LSPS Documentation
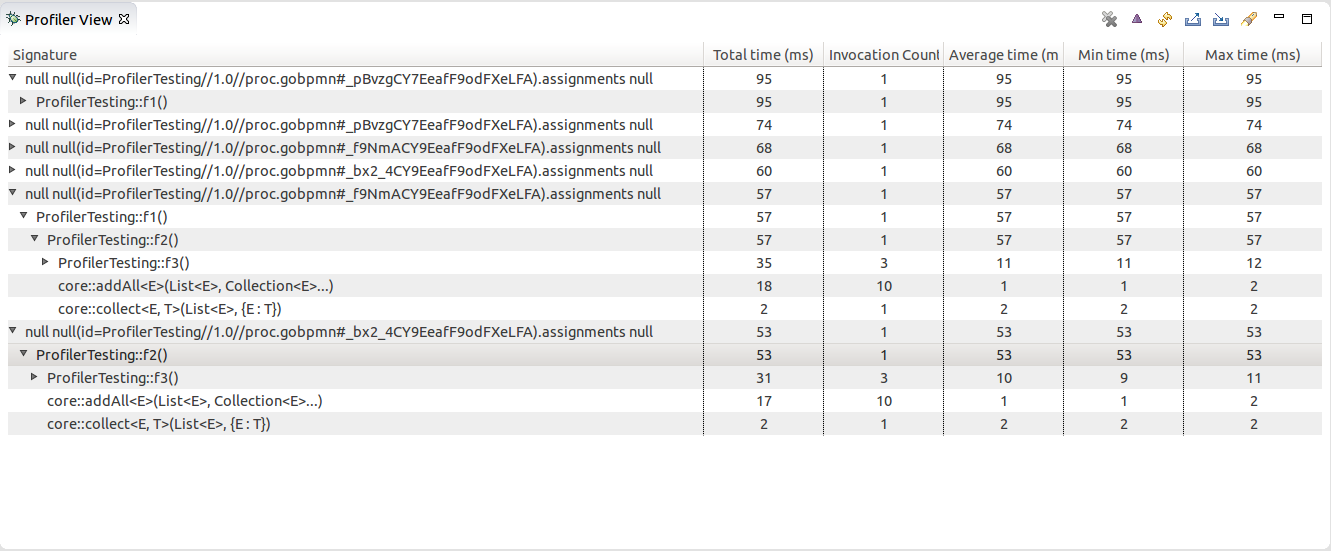
Profiling serves to identify possible performance problems in the execution of expressions, such as, function calls, assignment, multi-instance calls, etc.
The following profiling features are available:
The execution duration is counted cumulatively: when a function call takes longer than 1 ms in a node of the model instance tree, the call is included in the list (any function calls from the body of this function are considered part of the main function call).
To profile with LSPS Profiler, do the following:
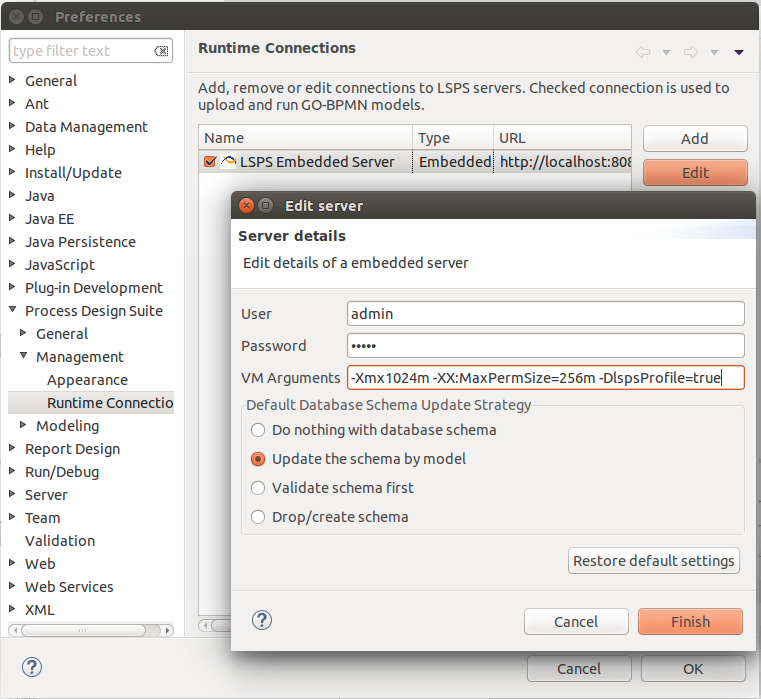
Enable profiling by running your server with the property -DlspsProfile=true.
For your Embedded server, you can do so as follows:
Run the models you want to profile.
Note that if other users are running models on the server, their model instances are be included in the results.
 button in the view toolbar.
To import and export profiling results in the XML format, click the export  button or the import
  button in the Profiler view respectively.
To profile with LSPS Trace Logger, do the following:
-Dcom.whitestein.lsps.lang.TimerInterpreterStackTrace.threshold; for example, set it to 100ms with -Dcom.whitestein.lsps.lang.TimerInterpreterStackTrace.threshold=100The log file for the PDS Embedded Server is by default located in <WORKSPACE>/.LSPSEmbedded/wildfly-<VERSION>/standalone/log/
Note that if other users are running model instances on the target server, their model instances will be included in the results.