To debug your models, run LSPS Server in debug mode, add breakpoints to modeling elements in your diagrams and expressions, and run the model on an LSPS Server; both the JVM and the LSPS Server must run in debug mode.
Debugger Implementation
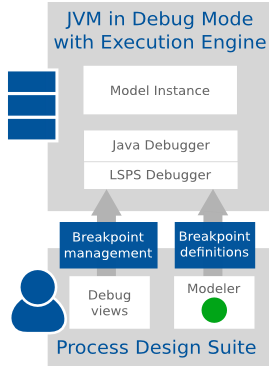
To debug your models, both the Execution Engine and the underlying JVM must run in debug mode. After you start the Execution Engine and JVM in debug mode, you can enable the debug mode in Designer. At that moment, the following happens:
- LSPS Debugger creates in the Execution Engine Java breakpoints: these serve to stop the execution when it encounters an LSPS breakpoint. You can check that the Java breakpoints are in place in the Breakpoints view. If you remove these Java breakpoints, the LSPS debugging will be disabled.
- Any LSPS breakpoints present on the server are discarded.
- The LSPS breakpoints defined in Designer are uploaded to the server.
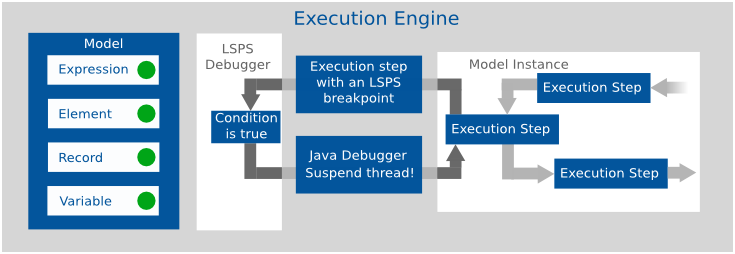
When you then run a model instance in debug mode with LSPS breakpoints on its modeling elements and expressions, and the execution hits a breakpoint, in an execution step, the breakpoint condition is evaluated and if the condition evaluates to true, the LSPS Debugger notifies the Java Debugger to suspend the execution in the execution step.
An execution step is any of the following:
- Sending a token to a process element
- Changing of goal status
- Interpreting an expression
- Assigning a value to a variable
- Assigning a value to a Record property
- Creating a record instance
LSPS debugger implementation
Setting up Debugger
You can connect the LSPS Debugger and debug a model instance that runs on an Execution Engine in a local JVM or on a remote JVM. Generally, you have the following options:
- Local:
- If you are debugging models and run the Default Application User Interface, debug model instances locally on the Designer Embedded Server
- If you are developing your custom Application User Interface, debug model instances locally on the SDK Embedded Server.
- Remote:
Generally, the connection of the LSPS Debugger to a server, remote or local, is defined in a debug configuration. However, the connection to Designer Embedded Server is integrated in Designer and it is sufficient to modify the server properties.
Debugger schema
Debugger on Designer Embedded Server
Note: The instructions are summarized also in a screencast.
When debugging on Designer Embedded Server, Designer connects to the server as to a remote server.
To run Designer Embedded Server in debug mode, do the following:
- Go to Server Connections > Server Connection Settings, select LSPS Embedded Server and click Edit.
In the VM Arguments field, add arguments that will run the JVM and the Execution Engine in debug mode:
-agentlib:jdwp=transport=dt_socket,server=y,suspend=n,address=4000 -DlspsDebug=true
The -DlspsDebug=true argument runs the Execution Engine in debug mode; the address argument defines the target port: you might provide another port number if required.
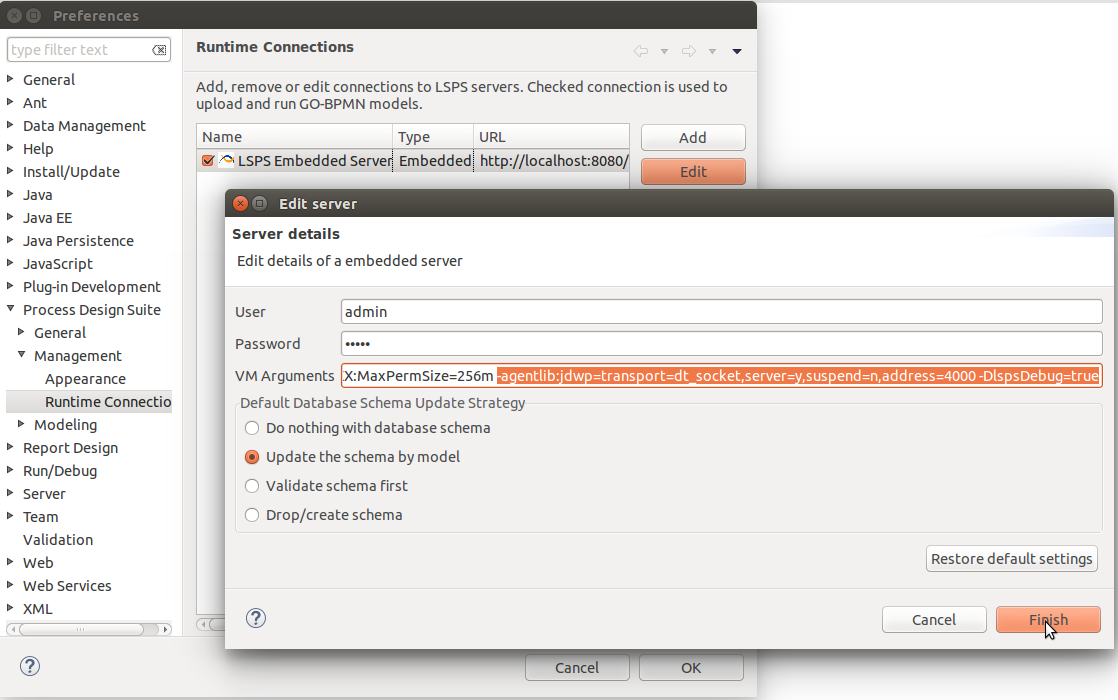
Debug parameters in Designer Embedded Server configuration
Important: Make sure the user used to establish the connection, in the example it is the admin user, has the security right for debugging: run the server, go to the Management perspective; and in the Person view, check that at least one security role of the Person has the Debugger:Manage permission.
- Click Finish and then OK in the error notification dialog.
- Start Designer Embedded Server.
- Create configuration and connect the Debugger:
- Switch to the Debug perspective.
- Go to Run > Debug Configurations > Remote Java Application.
- Click the New button and on the right define the details of the server:
- Set the host to
localhost and port the target port (from the vm arguments above 4000).
- Enter a Java project name into the Project field (create an empty Java project if no other Java project is available in the workspace).
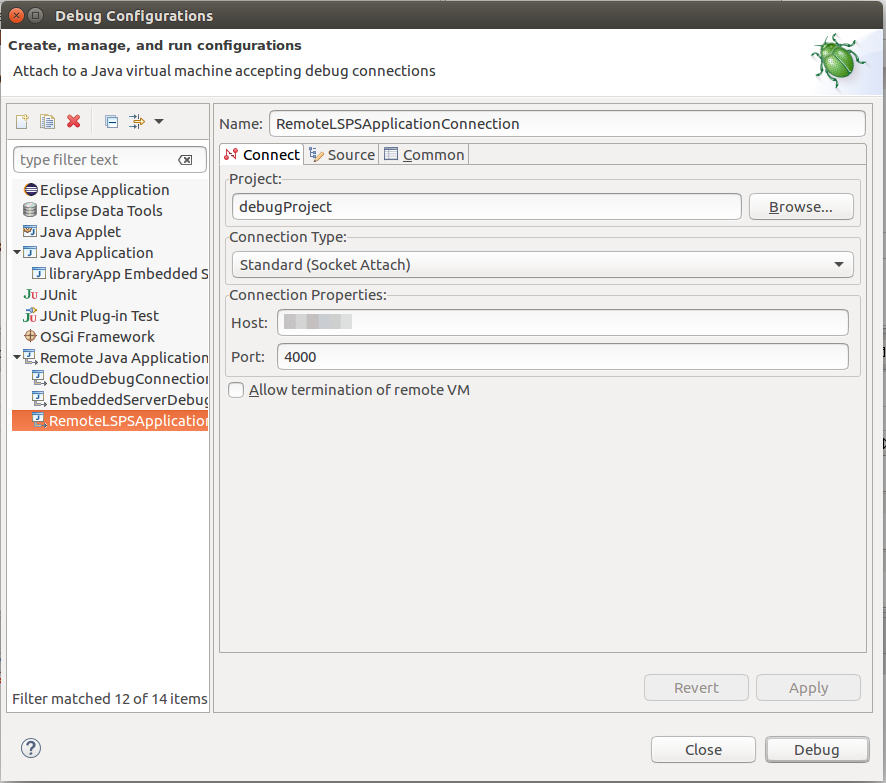
Setting debug configuration
- Run the debug configuration to attach the LSPS Debugger to the server.
- Enable debugging: click the Debug button in the LSPS Breakpoints.
Now you can debug the model: add breakpoints to the model and run the model.
Important: If your breakpoints are on expressions or code, not visual modelling elements, the debugger might be stuck before reaching the breakpoint: in such a case, double click the first method in the current thread to refresh the views.
Debugger on SDK Embedded Server
Note: The instructions are summarized also in a screencast.
To debug your Custom Application User Interface locally on SDK Embedded Server, do the following:
- Open the Debug perspective.
- Go to Run > Debug Configurations > Java Application > <YOUR_APP_LAUNCHER> (for example,
MyCustomApp Embedded Server Launcher).
- Edit the configuration: add the
-DlspsDebug=true VM argument.
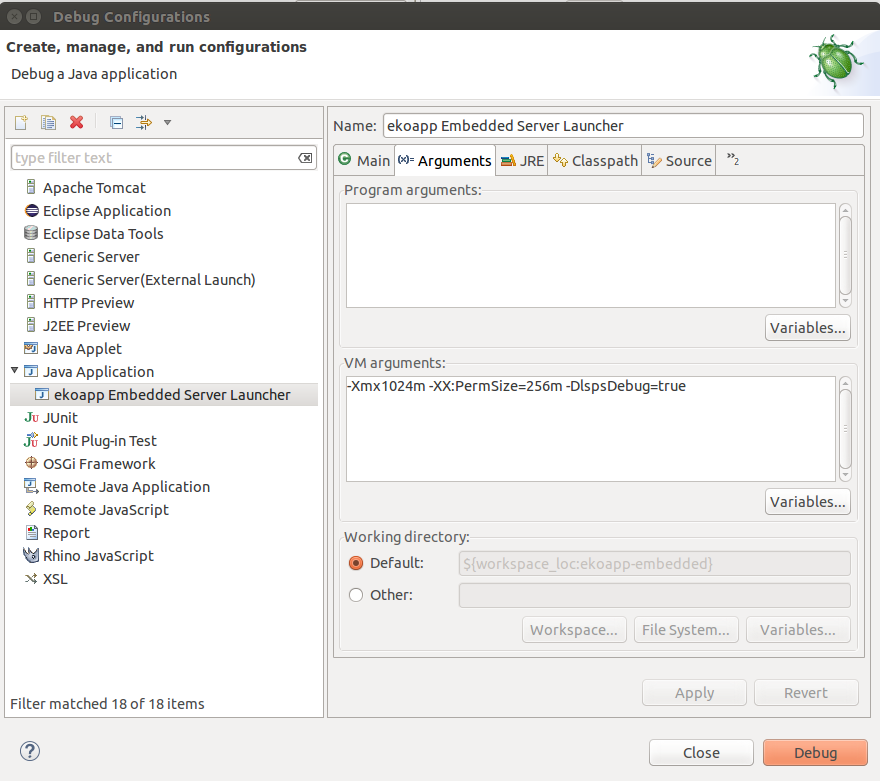
Setting application launcher configuration to debug mode
Under the hood, the connection is established on a free port automatically.
- Run the launcher configuration in debug.
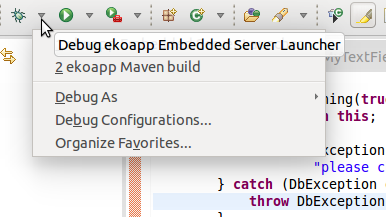
Running the launcher in debug
- Enable debugging: go to the Debug perspective and click the Debug button in the LSPS Breakpoints.
The LSPS debug is enabled: the Java breakpoints are in place.
- Now you can debug the model.
Debugger on a Remote Server
Important: Only one user can connect to the Execution Engine in debug mode since, on connection establishing, any LSPS breakpoints on the server are discarded. If you need to prevent such a scenario, restrict the access of users to the debug feature: remove from persons any security roles with the Debugger security right.
To set up LSPS debugging, do the following:
- Make sure the server with the LSPS Execution Engine runs in debug mode with the VM arguments:
-agentlib:jdwp=transport=dt_socket,server=y,suspend=n,address=<PORT> -DlspsDebug=true
- Open the Debug perspective.
- Create an empty Java project in your workspace.
- Go to Run > Debug Configurations > Remote Java Application.
- Click the New button and on the right define the details of the remote server.
Setting connection to a remote server
- Run the debug configuration to attach the LSPS Debugger to the server.
To start debugging, go to the Debug perspective and click the Debug button in the LSPS Breakpoints to enable the debugging.
When debugging is enabled, the following takes place:
- LSPS Debugger creates two Java breakpoints in the Execution Engine that are used to stop the execution on LSPS breakpoints.
- Any LSPS breakpoints present on the server are discarded.
- Designer uploads all LSPS breakpoints to the server.
The LSPS debug is enabled: the Java breakpoints are in place.
- Now you can debug the model: add breakpoints to the model and run the model.
Debugging a Model
Once you have established connection to the LSPS debugger, and enabled debugging, you can start debugging your model:
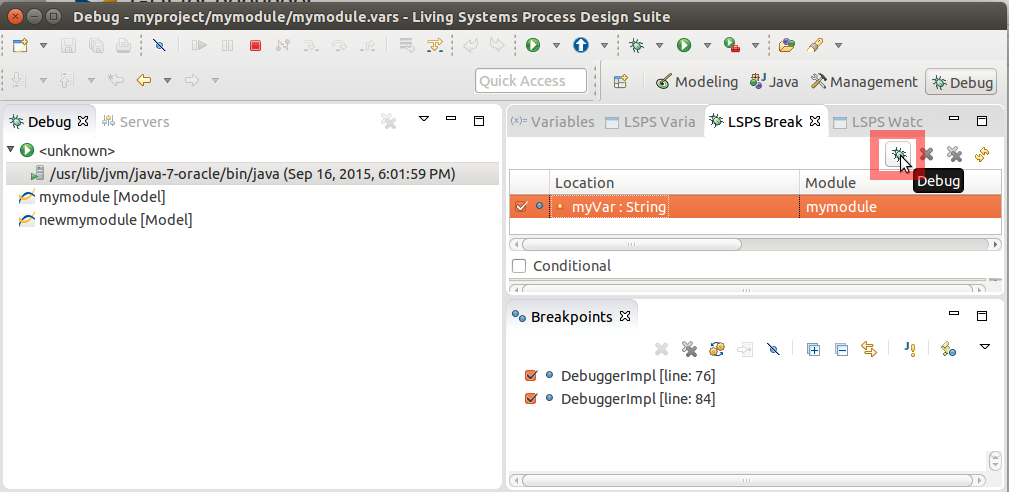
- Switch to the Debug perspective.
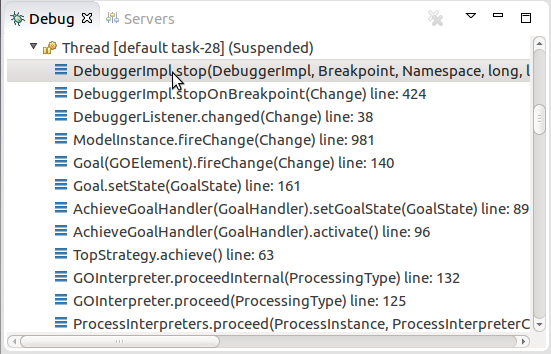
- Make sure the Debug view contains the server threads and the Breakpoints view the DebuggerImpl breakpoints.
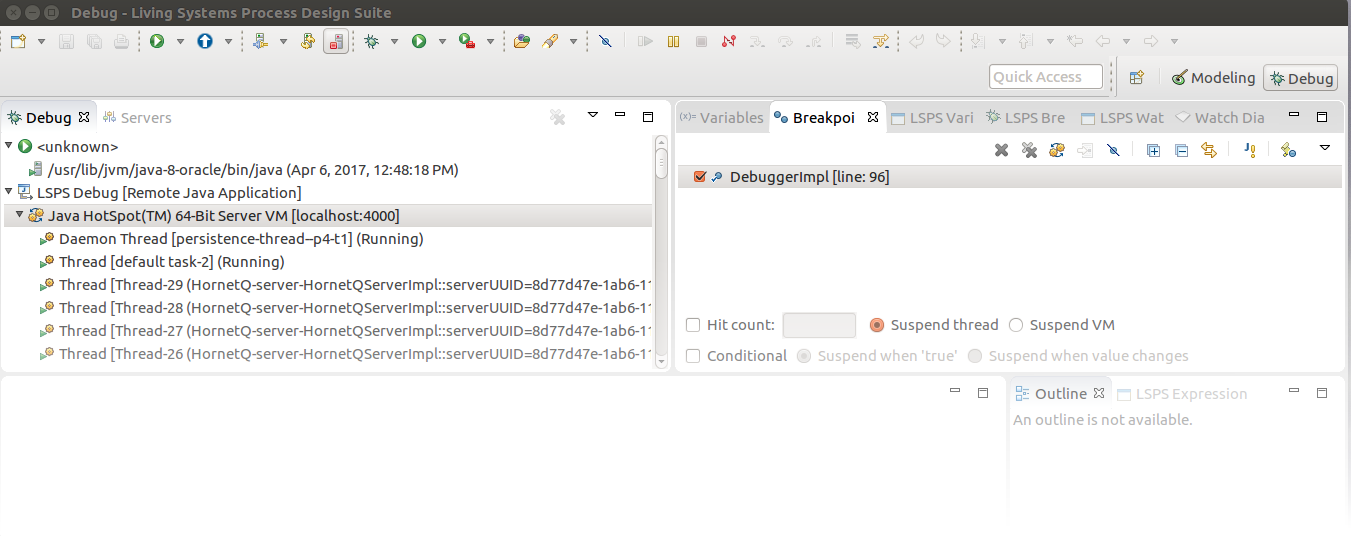
Local Embedded server in debug mode and debug enabled
- If applicable, connect the debugger: run the remote configuration.
- Switch to the Modeling perspective:
- Add breakpoints to the module resources.
- Run the Model.
- Switch to the Debug perspective.
- If at any point the views do not contain the correct data, double-click the first method in the current thread to refresh the views.
- Manage the debug execution with the buttons in the LSPS Expression view toolbar.
When the model instance hits a breakpoint, the Java thread of the Execution Engine is suspended. Note that the model instance state remains unchanged.
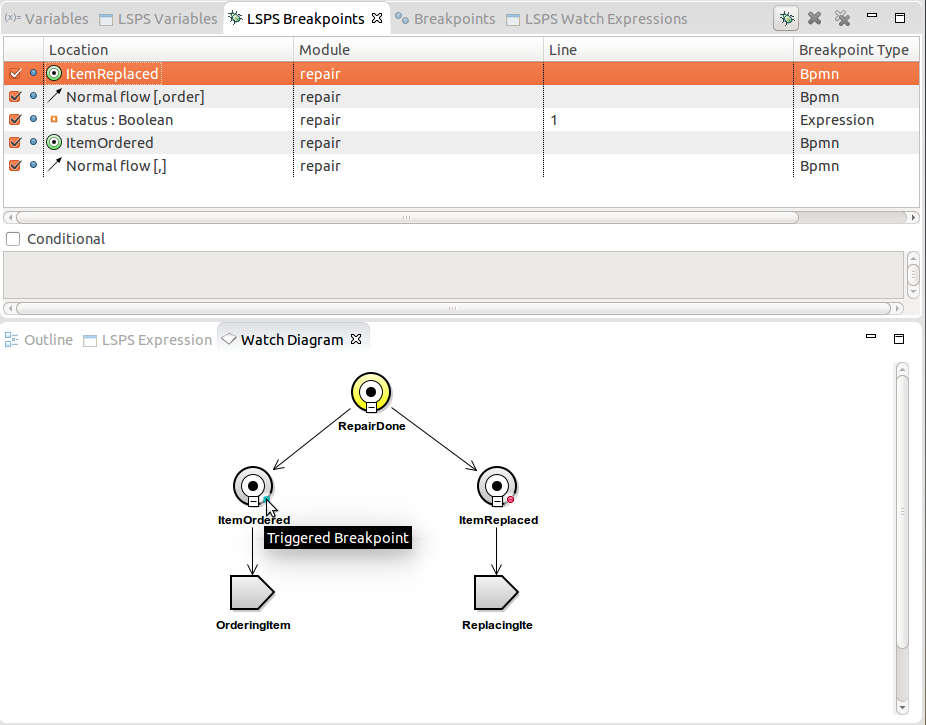
Once suspended, you can examine the model instance in the following views of the Debug perspective:
- Watch Diagram: diagram with the current breakpoint if the breakpoint is on a modeling element
- LSPS Expression: expression with the current breakpoint if the breakpoint is on an expression
LSPS Variables: variables from the current execution context
This includes modeling elements and their properties, variables, etc.
- LSPS Watch Expressions: expressions which are evaluated as the model is debugged
Adding and Removing Breakpoints
To add or remove a breakpoint to an element, do the following:
- In the Modeling perspective, open the resource with the respective element, such as, variable definition or an expression.
- Right-click the element and click Add Breakpoint or Remove Breakpoint.
You can add breakpoints to the following:
- expressions: right-click the expression and select Add Breakpoint from the context menu.
- BPMN modeling elements: right-click the element on the canvas and select Add Breakpoint from the context menu.
- Goals: right-click the element on the canvas and select Add Breakpoint from the context menu.
- variables: right-click the variable definition and select Add Breakpoint from the context menu.
- records or their properties: in the Outline view, right-click the record or its property and select Add Breakpoint from the context menu.
Important: Breakpoints on method or function signatures are ignored (add a breakpoint to the first expression in their bodies).
A breakpoint appears in the LSPS Breakpoints view in the Debug perspective and is displayed as a dot marker in the diagram.
When the breakpoint is triggered, it is visualized either in the Watch Diagram or in the LSPS Expression view, depending on the breakpoint type.
Active breakpoint in a Goal hierarchy
Defining a Breakpoint Condition
If a breakpoint defines a condition, it is activated only if the condition evaluates to true when the breakpoint is hit.
To add a condition to a breakpoint, select the breakpoint in the LSPS Breakpoints view and define the condition in the Condition area below.
Important: It is not possible to define a breakpoint on a loop with a condition so as to have the breakpoint activated at a certain iteration.
Resuming Breakpoints
To resume a model instance to the next breakpoint, click the respective button, such as Resume, Step Over, etc., in the LSPS Expressions view.
Enabling and Disabling Breakpoints
You can disable and enable LSPS breakpoints as well as define breakpoint conditions in the LSPS Breakpoints view.