LSPS documentation logo
LSPS Documentation
Profiling Tools

The profiling tools serves to identify possible performance problems in the execution of expressions, such as, function calls, assignment, multi-instance calls, etc.

The following profiling features are available:

  • Profiler that gathers a list of function, method, and closure calls with execution longer than 1 ms. The execution duration is counted cumulatively: when a function call takes longer than 1 ms in a node of the model instance tree, the call is included in the list (any function calls from the body of this function are considered part of the main function call).
  • Trace Logger prints data about invocations with execution longer than a defined period in milliseconds into the Log view and log file. This feature can be of use when LSPS Profiler is not a feasible option. Also, it might be more convenient as input for analysis in other systems.

Profiling with LSPS Profiler

To profile with LSPS Profiler, do the following:

  1. Enable profiling by running your server with the property -DlspsProfile=true.
    • For Designer Embedded server, do the following:
      1. Click the Stop Embedded Server button to stop Designer Embedded server.
      2. Go to Server Connections -> Server Connection Settings
      3. In the Preferences dialog under Designer -> Management -> Server Connections edit the LSPS Embedded Server connection.
        embeddedwithprofilerproperty.png
        Profiler-enabling property on the Embedded Server connection setting
      4. Click the Start Embedded Server 
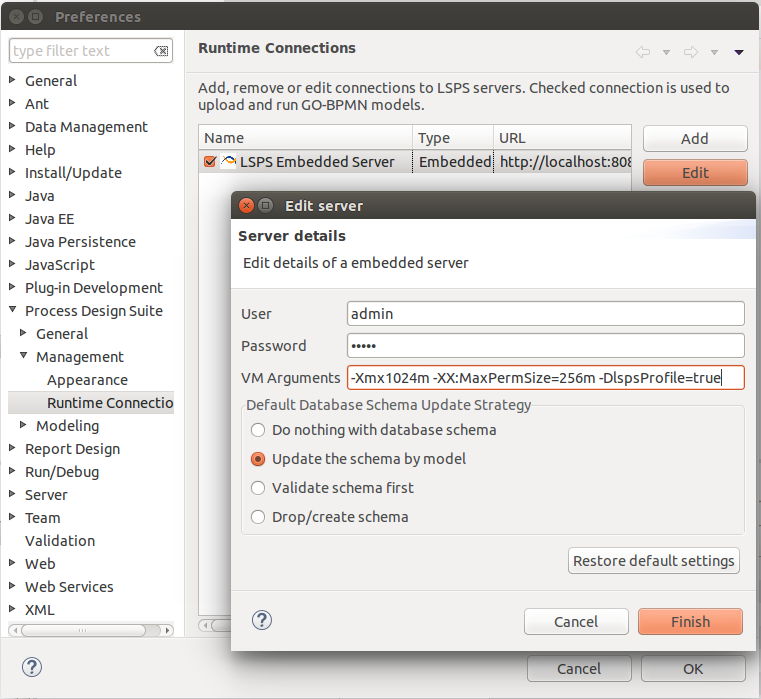
button to start Designer Embedded server.
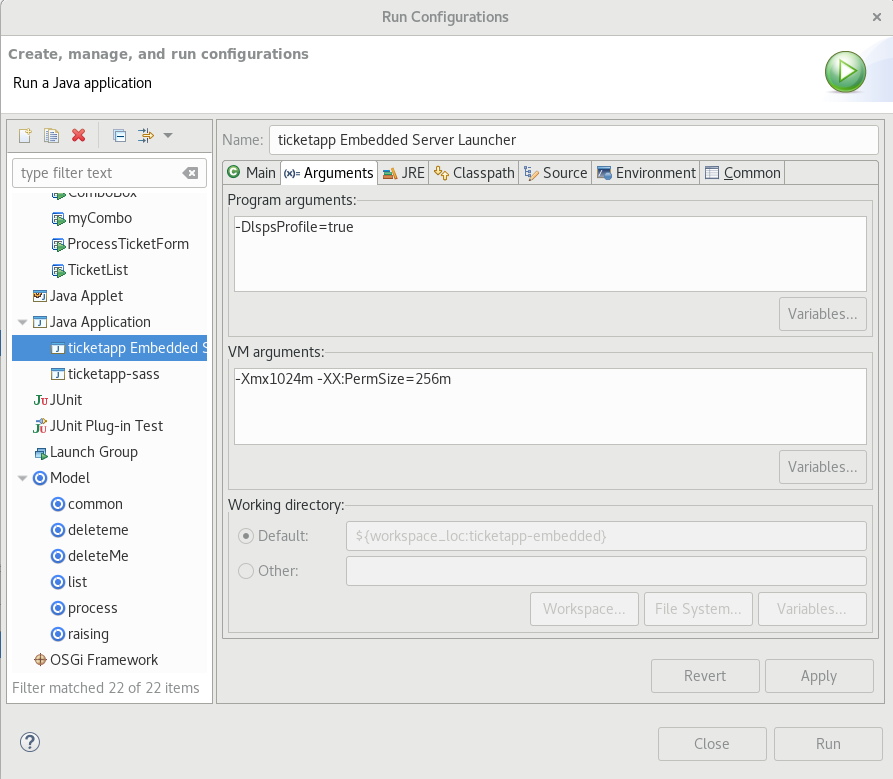
    • For the SDK Embedded server, do the following:
      1. In the Console view of the server, stop the remote server.
      2. Go to Run -> Run Configurations
      3. In the Run Configurations dialog, find the launcher under Java Application.
        profilerConfForSdkEmbedded.png
    • For remote connections, do the following:
      1. Stop the remote server.
      2. Run the server with the -DlspsProfile=true property.
  2. In the Management perspective, open the Profiler view.
  3. As applicable, upload and Run the models you want to profile.

    Note that if other users are running models on the server, their model instances are be included in the results.

  4. Refresh the Profiler view to display the profiling results: click the calls to display it in the Module if this is available in the Workspace.
profilingview.png
Profiler view with results
Note that the list with the function statistics contains the most recent function calls. To display the most expensive function calls of the profiling sessions, click the Expensive Operations 
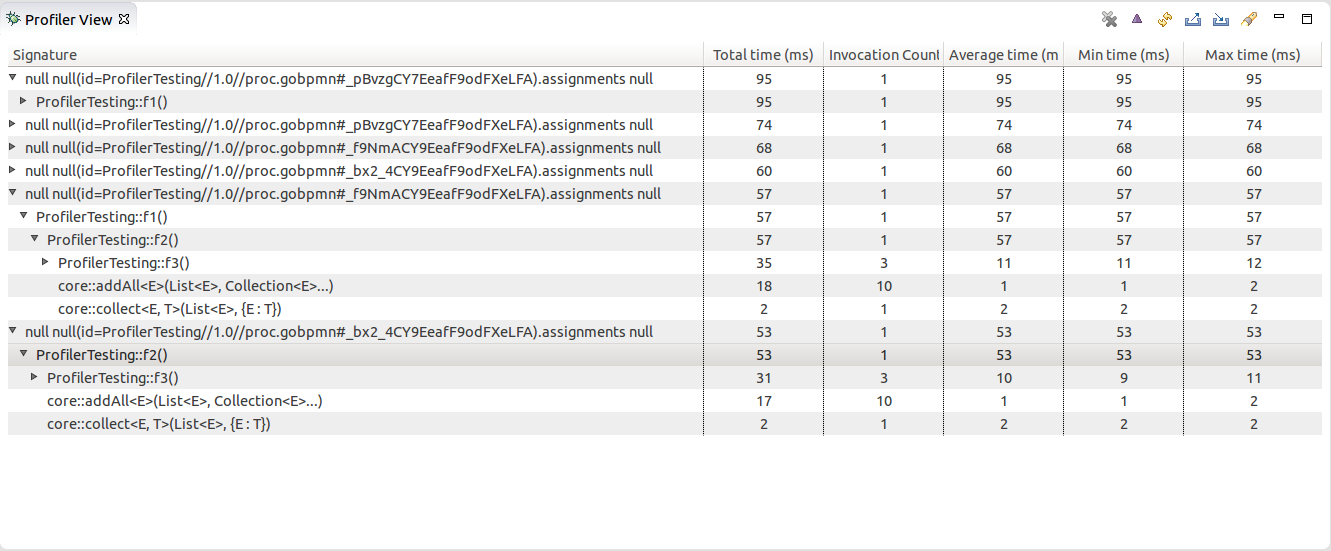
button in the view toolbar.

To import and export profiling results in the XML format, click the export button or the import button in the Profiler view respectively.

Profiling with Trace Logger

To profile with LSPS Trace Logger, do the following:

  1. Enable profiling by running your server with the property:
    -Dcom.whitestein.lsps.lang.InterpreterStackTraceFactory=com.whitestein.lsps.lang.TimerInterpreterStackTraceFactory
    
    You can set also the threshold execution time (by default 5ms) with the property
    -Dcom.whitestein.lsps.lang.TimerInterpreterStackTrace.threshold
    for example, set it to 100ms with
    -Dcom.whitestein.lsps.lang.TimerInterpreterStackTrace.threshold=100
  2. Run the models you want to profile.

The log file for Designer Embedded Server is by default located in <WORKSPACE>/.LSPSEmbedded/wildfly-<VERSION>/standalone/log/

Note that if other users are running model instances on the target server, their model instances will be included in the results.