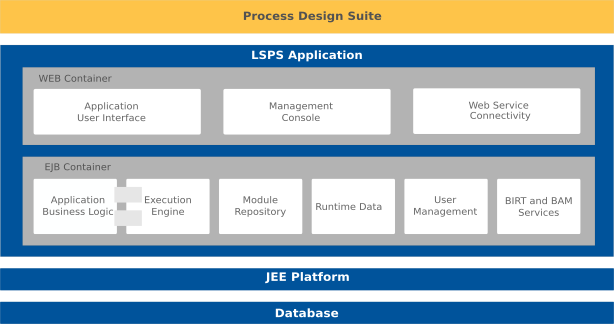
You will design your models and related resources for the Living Systems® Process Suite, in the integrated development environment called Living Systems® Process Design Suite (PDS), a programming platform based on Eclipse. The environment provides the tools for modeling of business processes, and communication with an LSPS Application. This allows you to create your models, deploy, manage, and monitor the execution from a single environment.

Note: If you install the SDK component in the PDS, you can generate the LSPS Server EAR with sources of the Application User Interface and modify them. For further information, refer to the development guide. and for instructions on how set up your own application server with the LSPS Application, refer to the deployment guide.
This guide focuses on the features related to the PDS environment and generally does not contain information on customization of the LSPS Application User Interface, the concepts related to GO-BPMN, or the Expression Language: refer to the respective guides for such information.
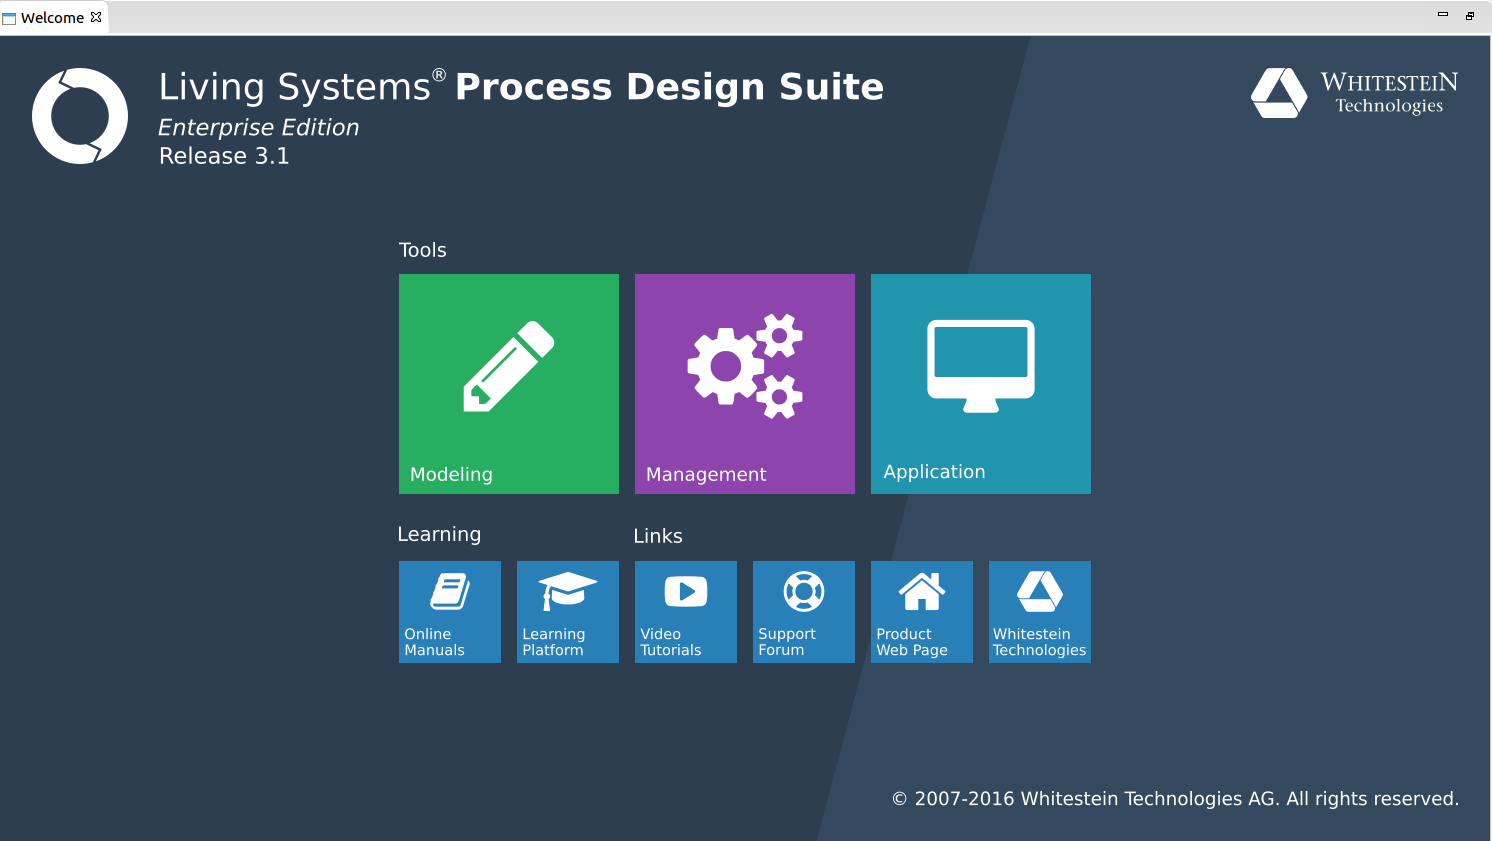
After you have installed the PDS Enterprise Edition, run the Process Design Suite:
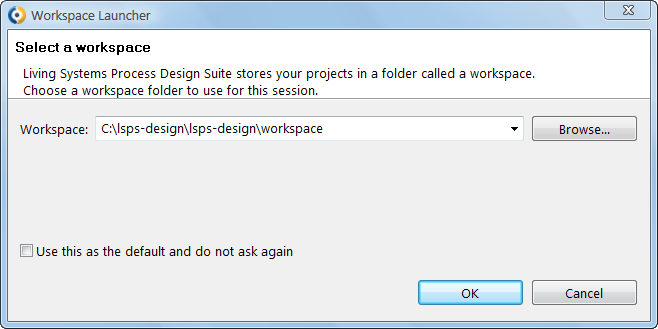
<LSPS_HOME>.lsps-design binary for your platform:lsps-design.exe and on Windows with 32-bit architectureslsps-design_64.exe on Windows with 64-bit architecturesProcess Design Suite on Maclsps-design on LinuxIn the Workspace Launcher dialog box, choose a workspace directory and click OK.
If the chosen workspace folder does not exist, it will be created. A workspace is a folder, where the resources stored during the session are located. Its content is reflected in the workbench.


Note: If the Welcome command is disabled, open a Process Design Suite perspective: go to Window > Open Perspective > Other and in the Open Perspective dialog box, click a Process Design Suite perspective.
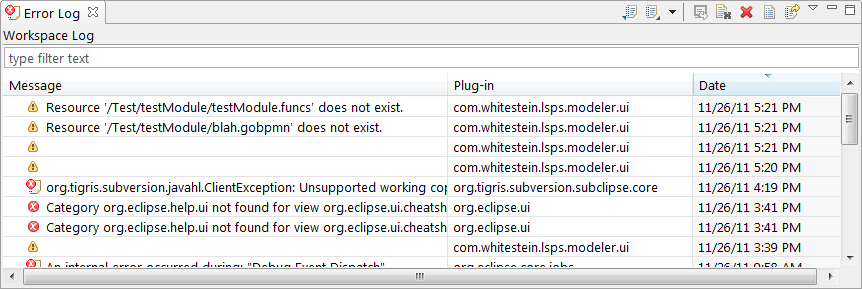
Errors thrown by the Process Design Suite and other environment plug-ins are available in the Error Log view. Each error entry shows information about the plug-in the error was generated by, and date and time when it occurred.
Double-clicking an error entry opens Event Details dialog box with detailed information on the respective error message including the date and time of its occurrence, its severity, error message, its stack trace, and session data.
Error Log can contain also entries of the server if these were caused by a Process Design Suite feature, which appear primarily in the Console view.
