To navigate through views of the Process Management Console environment, use the navigation toolbar located on the left: The relevant content is displayed in the area on the right.
The following views are available:
- To-dos: List of all To-do in the Navigation Engine
- Modules: List of Modules uploaded to the Module Repository
- Model Instances: List of Model instances in the Navigation Engine
- Logs: Logs created by Log tasks of Processes
- Webservices: Webservices requests and responses involved in Webservices Tasks of Processes
- Persons: Users with their details and rights
- Roles: Roles created based on elements of Organization Models
- Security Roles: Security Roles
- Exceptions: Exceptions logged by the Navigation Engine
- Dynamic Themes: List of available CSS themes
- Model Update Logs: Logs of model update processes
Management Console environment
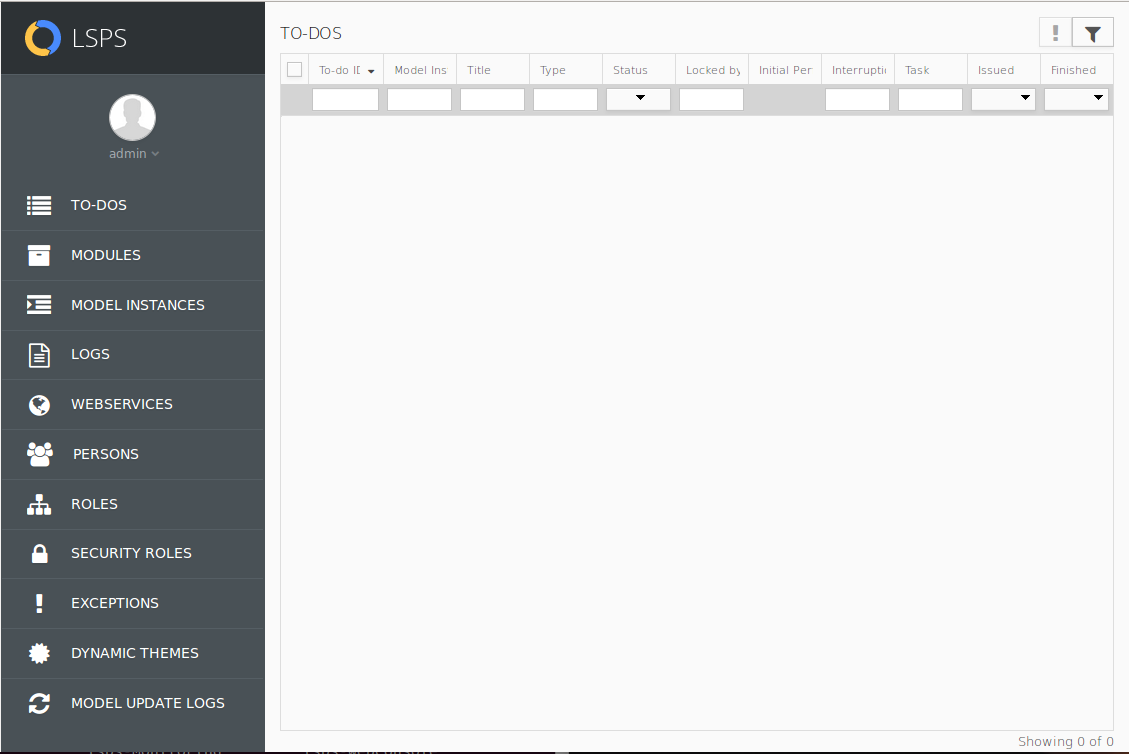
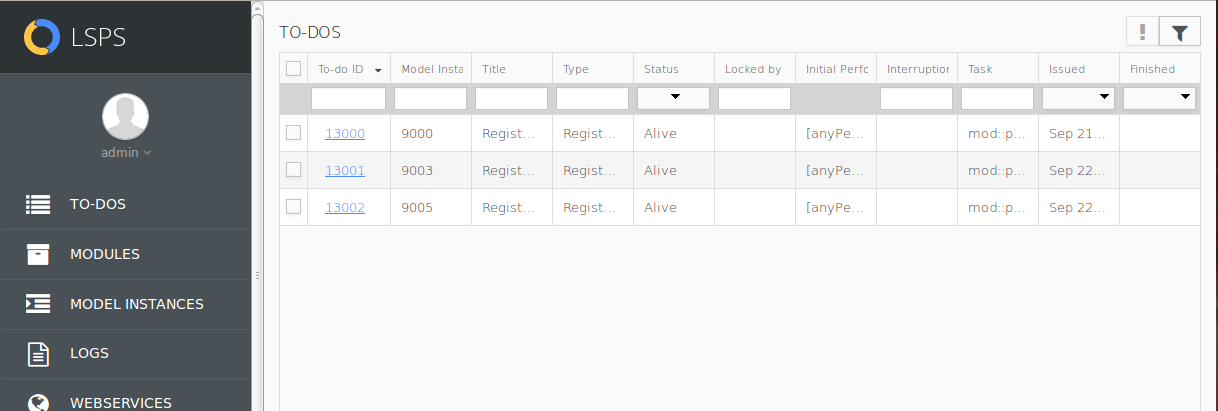
To-dos View
The To-dos view contains a list of all to-dos dispatched by the Navigation Engine and their details.
The to-dos are listed in a table with the following data:
- To-do ID: unique to-do ID
- Model Instance ID: ID of the parent model instance (the to-do was generated by a User Task of one of the module instances of this model instance)
- Title: todo title defined by the title parameter of its User Task
- Type: name of the User Task that generated the to-do
- Status: status of the User Task (for information on the task life cycle, refer to GO-BPMN Modeling Language Guide)
- Locked by: name of the person, who has locked the to-do
- Performers: the expression used to obtain the users to whom the to-do was initially allocated
- Interruption Reason: reason why the to-do was terminated, such as, the parent model instance was terminated
- Task Namespace: full path of the User Task
- Issue Date: date when the to-do was issued
- Submitted: date when the to-do was submitted (became finished)
From the view, you can search for orphaned to-dos, escalate and reset alive to-dos, and display to-do details.
To-dos page
To-Do Detail
A To-do Detail appears after clicking a to-do ID or name in the To-do List or on the To-do page.
The To-do Detail page contains the following to-do information:
- To-do ID: unique to-do ID
- Model instance ID: ID of the model instance that produced the to-do
- External link: link to the to-do content
- Title: task title
- Task: namespace path and name of the to-do's user task
- Status: task execution status
- Issued: date and time, when the to-do was generated
- Initial Performs: expression used to acquire the initial potential performers for the to-do
- Assignees: users who can see the to-do
- Finished: date and time, when the to-do was finished (submitted or interrupted)
- Locked by: person who has locked the to-do
- To-do notes: notes provided by users of the Application User Interface
- Delegation level: current level of delegation
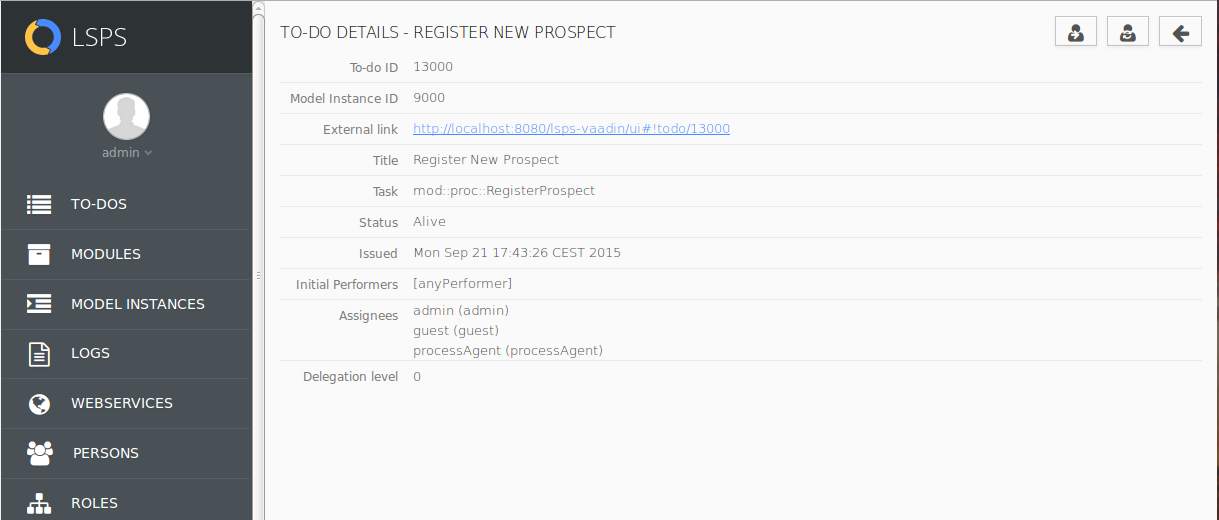
To-Do detail
From the to-do detail, you can delegate the to-do or undo a delegation and reassign to-dos.
Modules View
The Modules view contains a list of modules uploaded on the LSPS Server. From the view, you can perform module-related actions, including upload, unload, instantiation, and update.
You can also filter the module list based on their details.
Model Instances View
The Model Instances view contains a list of all model instances in the LSPS Server (Execution Engine) with their details:
- ID: unique ID of the model instance
- Model ID: ID of the underlying model
- Model name: name of the underlying model
- Model version: version of the underlying model
- Started: time when the model instance was created
- Finished: time when the model instance finished
- State: current execution status of the model instance
You can filter the table content by entering the filter values in the respective header cell and press ENTER.
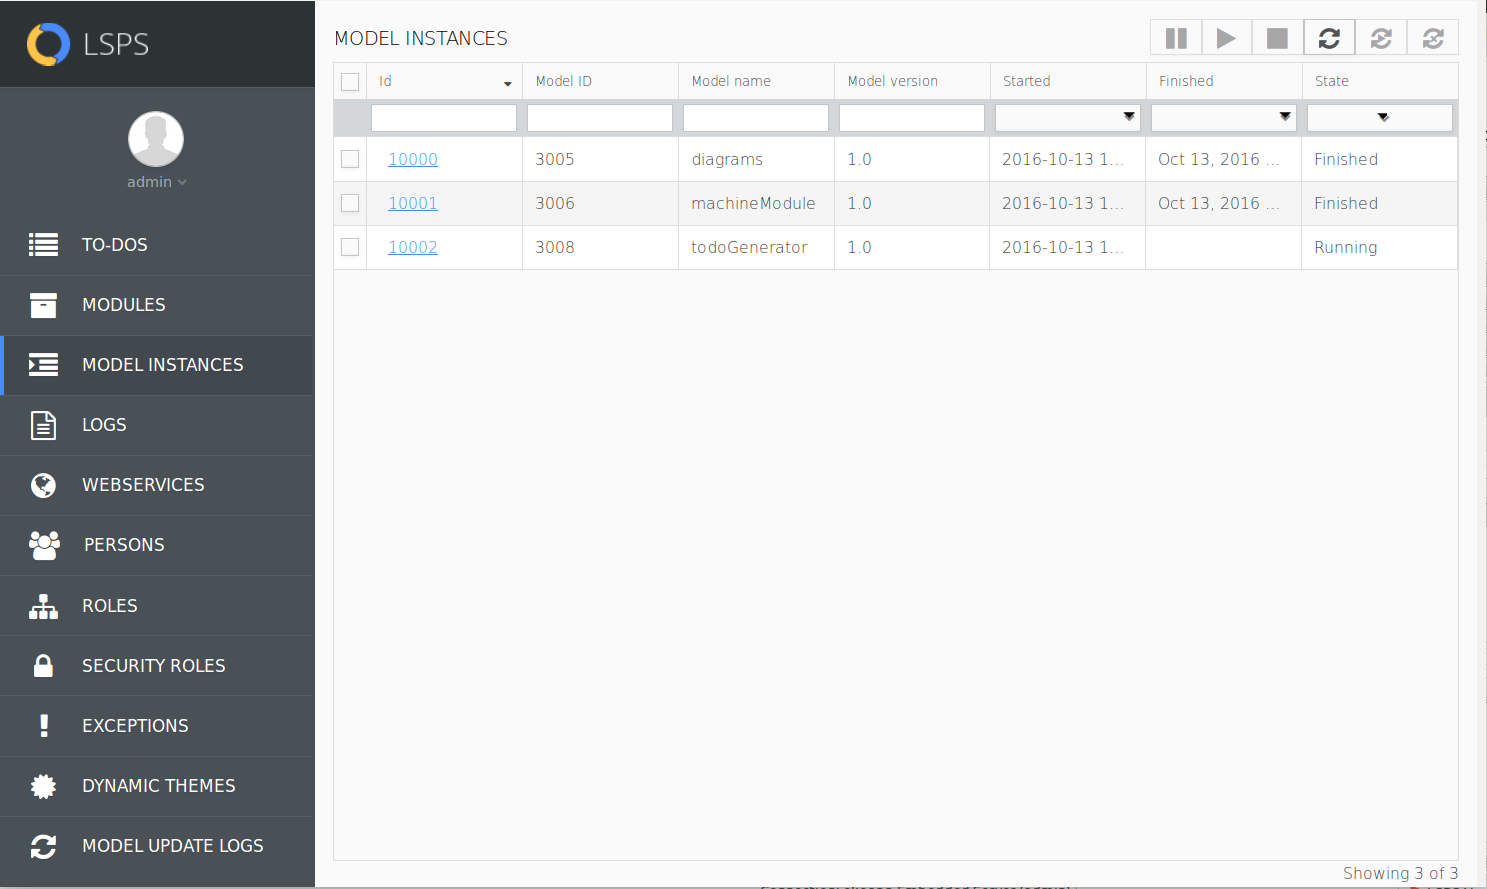
Model Instances
Selected model instances can be managed using the buttons in the view toolbar.
Model Instance Detail
Model instance detail view contains multiple tabs with detailed information about a model instance.
To open a detail of a model instance, click the model instance ID in the Model Instances view.
On the view toolbar, the actions related to the displayed tab are available.
Model Instance Detail
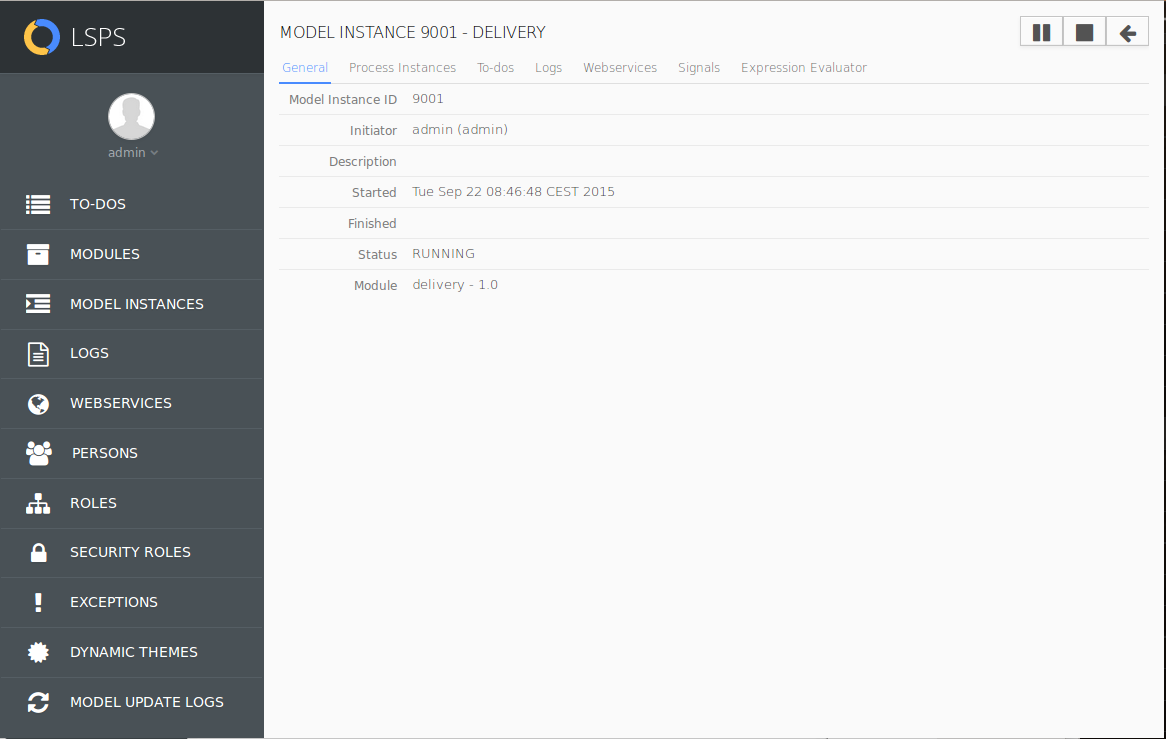
General Tab
The General tab contains general information about a model instance.
- Model Instance ID: unique model instance ID
- Initiator: person, who created the model instance
- Description: free-text description
- Started: date and time of model instance creation
- Finished: date and time of model instance termination
- Status: current execution status of the model instance
- Module: name and version of the executable module that was used to create the model instance
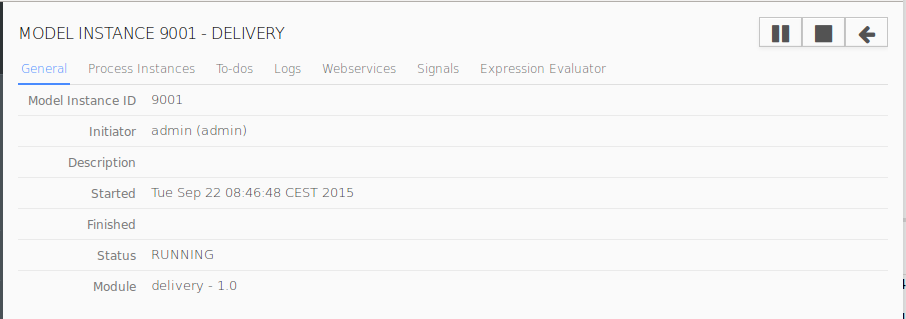
The General tab in a Model Instance detail view
Context Tab
The Context tab contains the runtime data of the model instance including their parameter values, and a tree structure of the model instance with details on the displayed elements:
Parameters of the model: Initiator, Description, and other metadata provided when the instance was created
Value of the parameters is in the Value column.
- Tree with modules, their global variables, processes, and Goals, Plans and Diagrams: the details for individual elements are in the given table row.
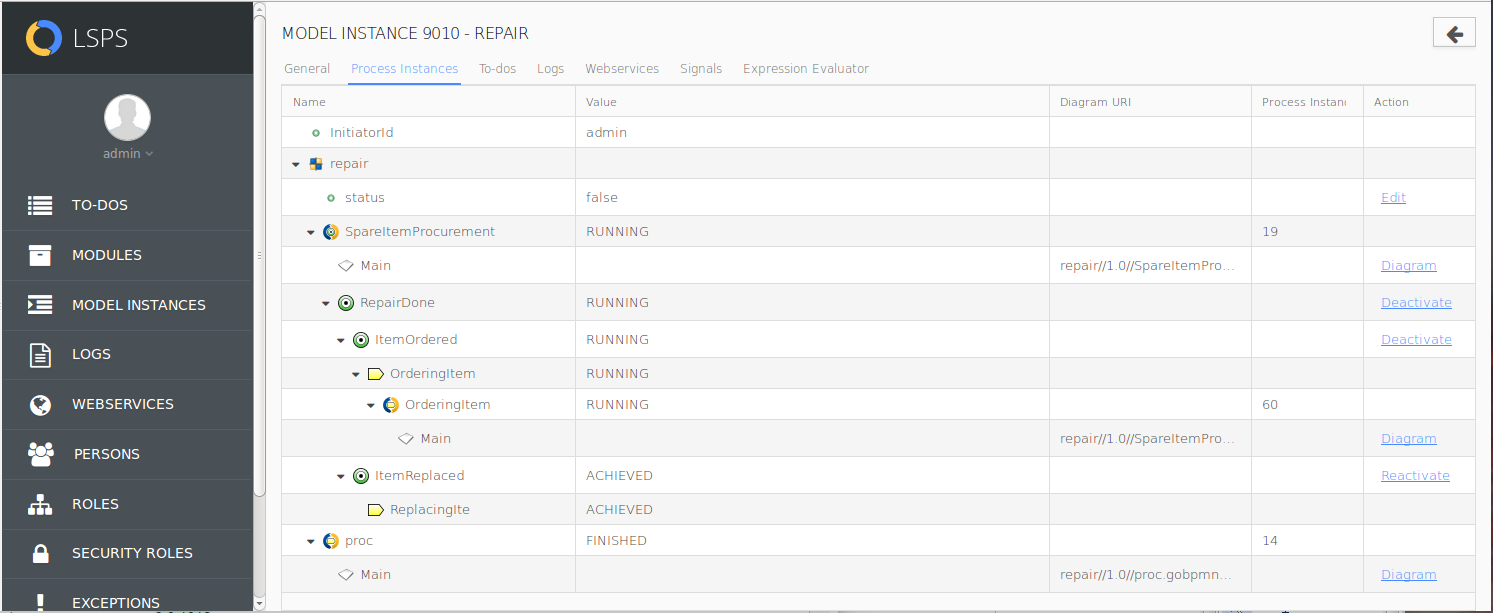
Context tab
To-dos Tab
The To-dos tab contains all to-dos generated by the respective model instance and their details.
- To-do ID: unique to-do ID number
- Title: title of the underlying user task
- Type: name of the user task
- Status: to-do status (
Alive, Accomplished, or Interrupted)
- Locked By: name of the person, who has locked the to-do
- Initial Performers: names of initial performers
- Interruption reason: reason why the to-do was finished without completion if applicable (for example, due to process deactivation or model update)
- Task: task path and task name (mostly
module name::process name::plan name::task name)
- Issued: date when the to-do was issued
- Finished: date when the to-do was finished
Clicking a to-do ID opens the to-do detail. Note that you can filter for any orphaned to-dos from this tab: click the Filter button in the upper right corner and define the filter properties.
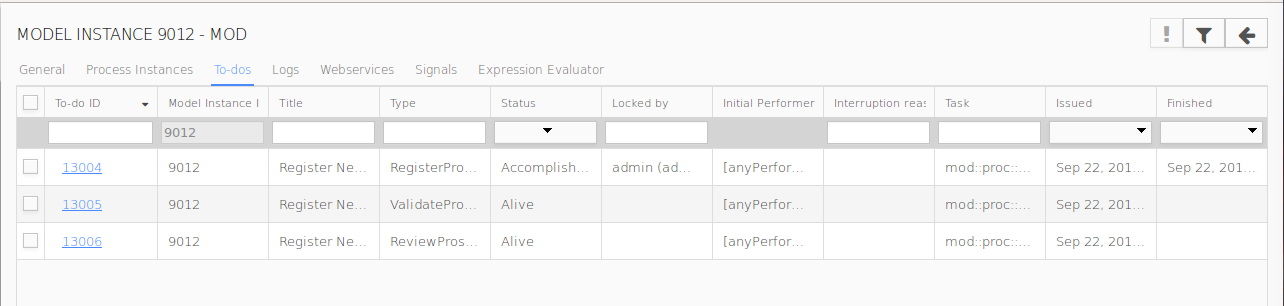
To-dos Tab
Logs Tab
The Logs tab contains a table with messages logged by Log tasks, tasks of the Log task type, executed as part of the model instance.
For each log entry, the table shows:
- Log ID: unique log ID
- Timestamp: date when the message was logged
Level: severity of the log message defined as an integer value
If the user defines a filter values, all logs with a value greater that the defined value are displayed.
- Description: log message content
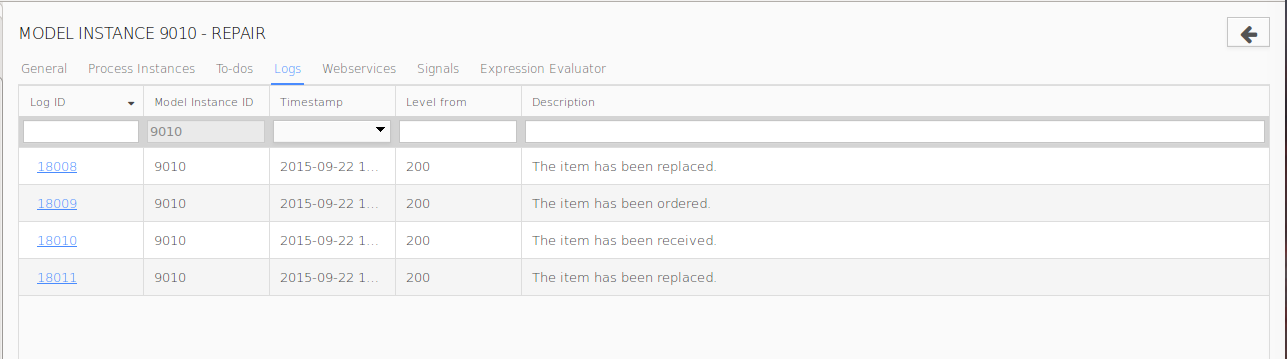
Logs tab
Web Services Tab
The Web Services tab contains a list of active and processed wait points (waiting for a web-service request from a client) of a model instance.
The Web Services tab contains a table with all wait points of web service clients in the model instance:
- ID: unique wait point ID
- Operation URI (Unified Resource Identifier): identifier of the resource (if several wait-point requests are processed by the same task type, value of their operation URI is identical. However, their wait-point IDs differ)
- Created: time when the wait point was created
- Request: link to the XML received from the client
- Request Received: time when the client request was received
- Response: link to the XML sent to the client and information on the response type (
time-out, error, finished, terminated)
- Finished: time when the Web service response was sent
- Response timed out: if the response time was overstepped
- Terminated: if the wait point was erased due to parent element termination
- Error response: if the received response was an error response
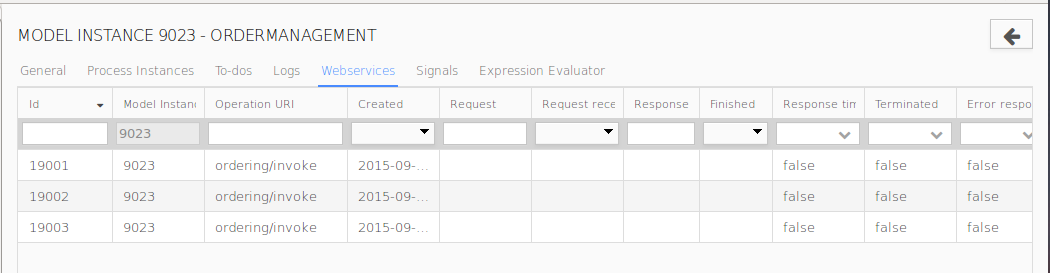
Webservices Tab
Signals Tab
The Signals tab contains a list of signals waiting to be consumed generated by a model instance.
Waiting signals may be removed.
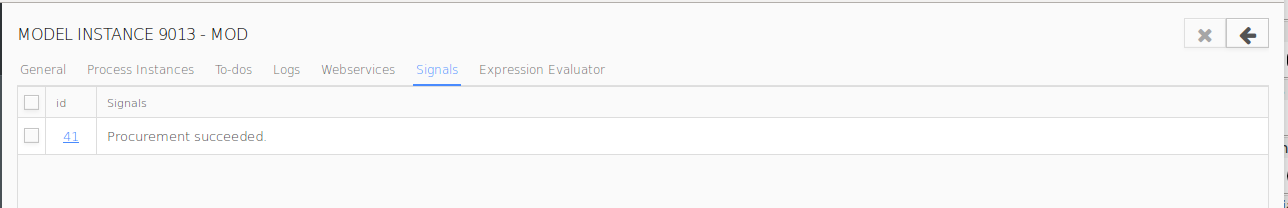
Signals tab
Expression Evaluator Tab
The Expression Evaluator tab enables you to evaluate expressions defined in the Expression Language in the context of the model instance.
By default, the evaluated expressions have no impact on the persisted data, that is, on Shared Record instances. If you want to apply the expression on Shared Records, select the Persistent option.
Note: You cannot use data from a local contexts of the model instance.
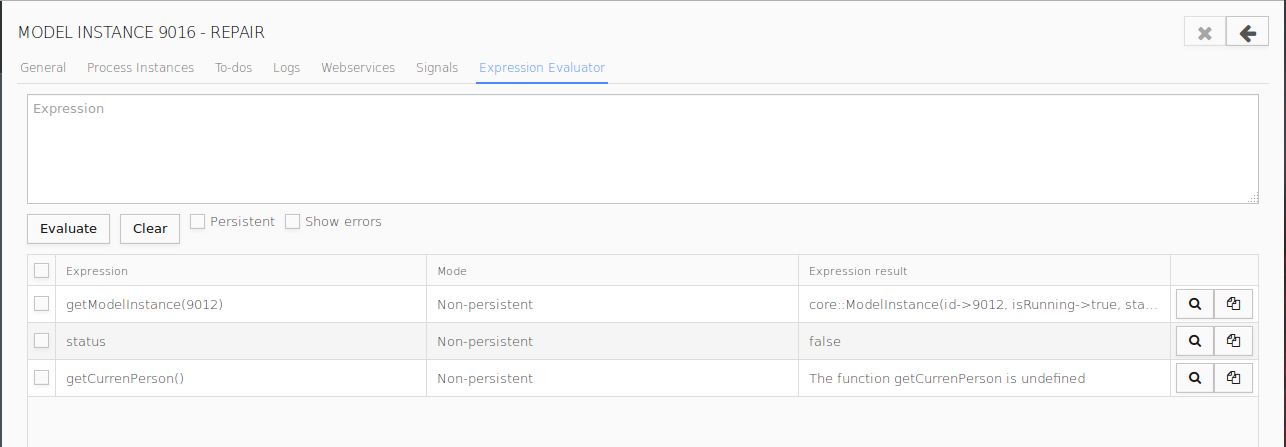
Expression Evaluator
Show Errors enables you to display detailed error messages in case some of the expression could not be evaluated.
Saved Documents View
The Saved Documents view lists the documents users have saved and are hence probably working on. You can export the documents as XMLs and import the modified documents back: this enables you the modify the runtime data of saved documents. Note that the export and import features are subject to the security right Document:Write.
Logs View
The Logs view contains a table with messages logged by Log Tasks, tasks of the Log task type, executed as part of the model instance.
For each log entry, the following details are displayed in the log table:
- Log ID: unique log ID
- Model Instance ID: ID of the parent model instance of the Log task
- Timestamp: date when the message was logged
Level: severity of the log message
When filtering according to the log level, any logs with severity higher that the defined value are displayed.
- Description: log message content
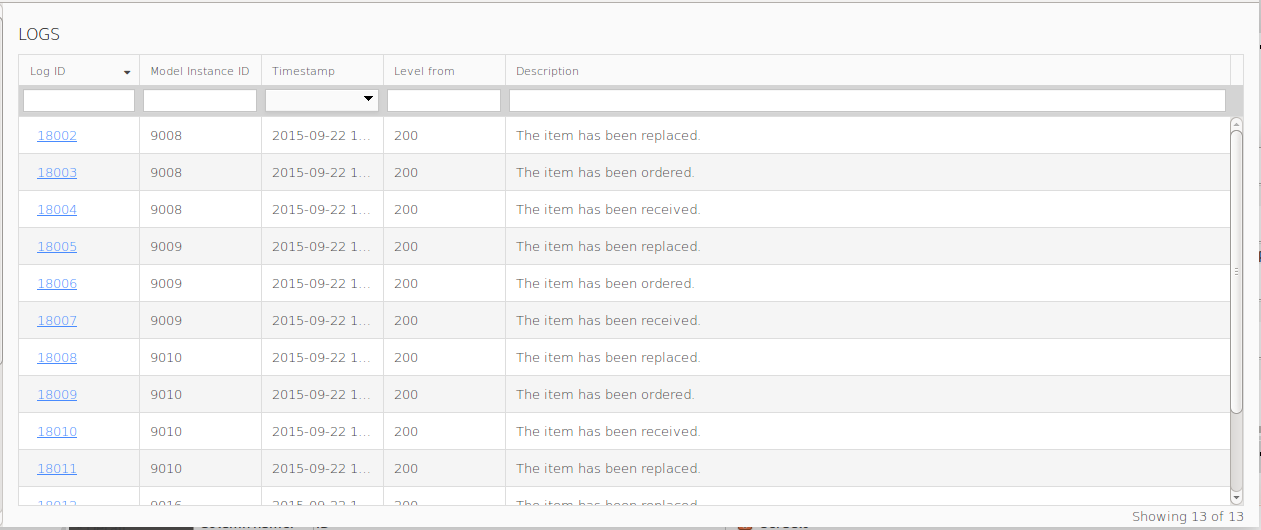
Logs page
Web Services View
The Web Services view contains a list of active and processed wait points (waiting for a Web service request from a client).
The Web Services view contains a table with wait points details:
- ID: unique wait point ID
- Model Instance ID: ID of the model instance processing the Web service request
- Operation URI (Unified Resource Identifier): identifier of the resource
Note: If several wait-point requests are processed by the same task type, value of their operation URI is identical. However, their wait-point IDs differ.
- Created: time when the wait point was created
- Request: link to the request XML received from the client
- Request Received: time when the client request was received
- Response: link to the response XML sent to the client and information on the response type (
time-out, error, finished, terminated)
- Finished: time when the Web service response was sent
- Response timed out: if the response time was overstepped
- Terminated: if the wait point was erased due to parent element termination
- Error response: if the received response was an error response
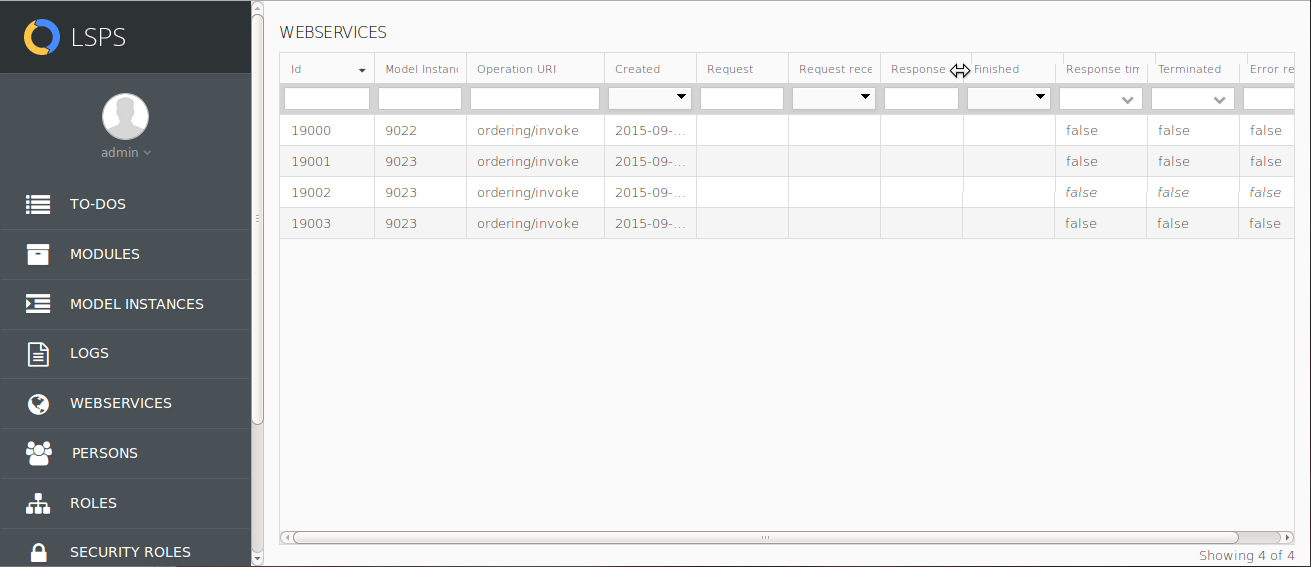
Web Services view
Persons View
The Persons view shows a list of persons, that is, LSPS users, as defined on the LSPS server.
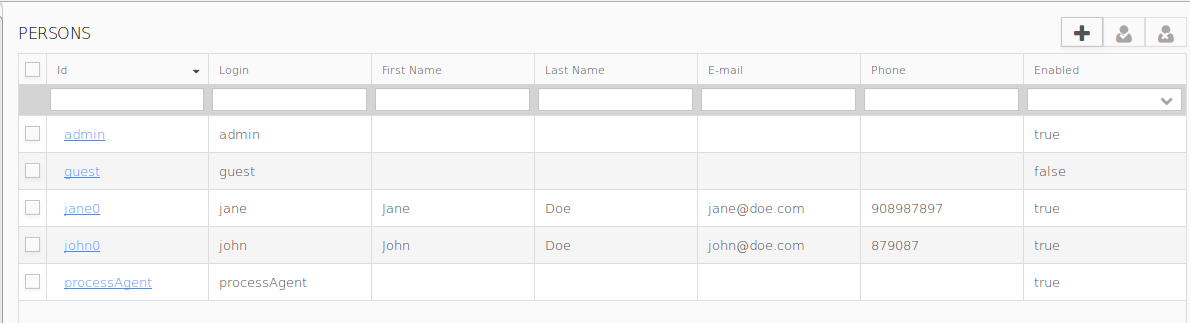
Persons View
By clicking a person id, you can display the person detail.
Using the buttons in the view toolbar, you can add a new person, disable selected persons, or enable selected persons.
Person Detail View
The Person Detail view shows details of a person including substitution setting, their security and modeled roles.
The detail appears after clicking a person id in the Persons or Roles view.
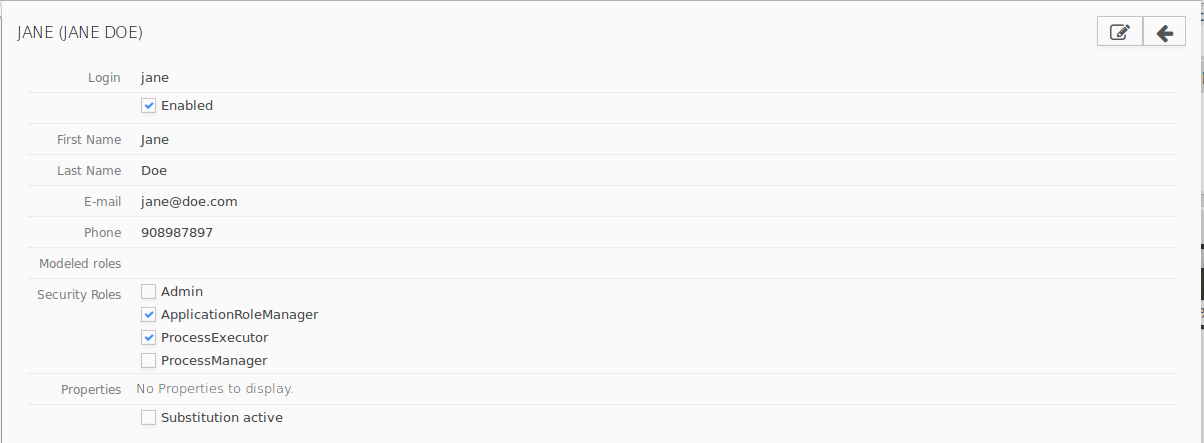
Person Detail view
Roles View
The Roles view contains lists of runtime and modeled roles defined in organization definitions of modules on the server.
If a runtime role is selected, persons with the runtime role are shown in a table displayed on the right.
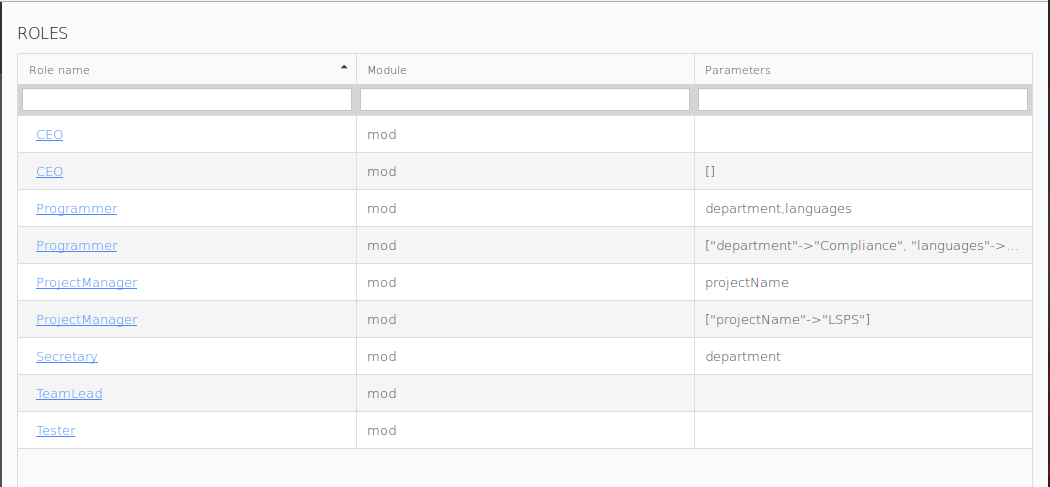
Roles view with runtime and modeled roles
Security Roles View
The Security view contains the list of available security roles.
Every active user has at least one security role, which restricts the actions they can perform in runtime; security roles define a particular set of security rights:
- Security right is a right to perform an action.
- Security role is a group of security rights.
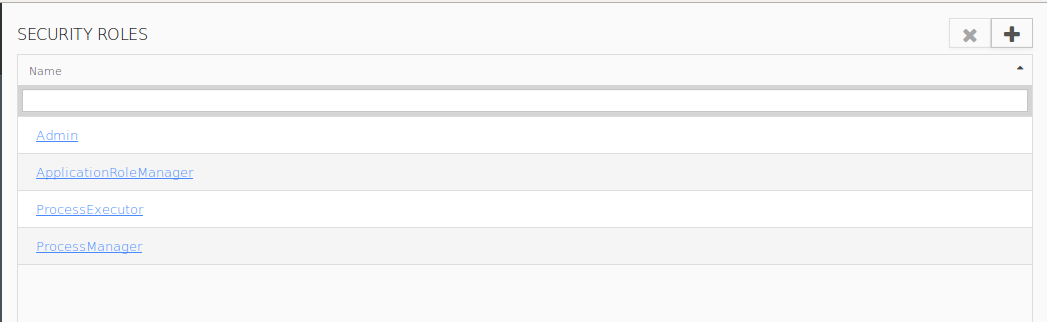
Security view
Exceptions View
The Exceptions view contains a list of all server exceptions and their details.
The Exceptions view contains:
- filter area to filter the exceptions listed below
- table with exception and their details:
- ID: ID of exception
- Exception: the first line of the exception
- Creation Time: time when the exception occurred
Resend: date when the resend has successfully taken place
To resend an exception, select it in the list and click the Resend  button.
- Invoked Component: component which generated the exception
To view the stack trace of an exception, click the exception id in the table.
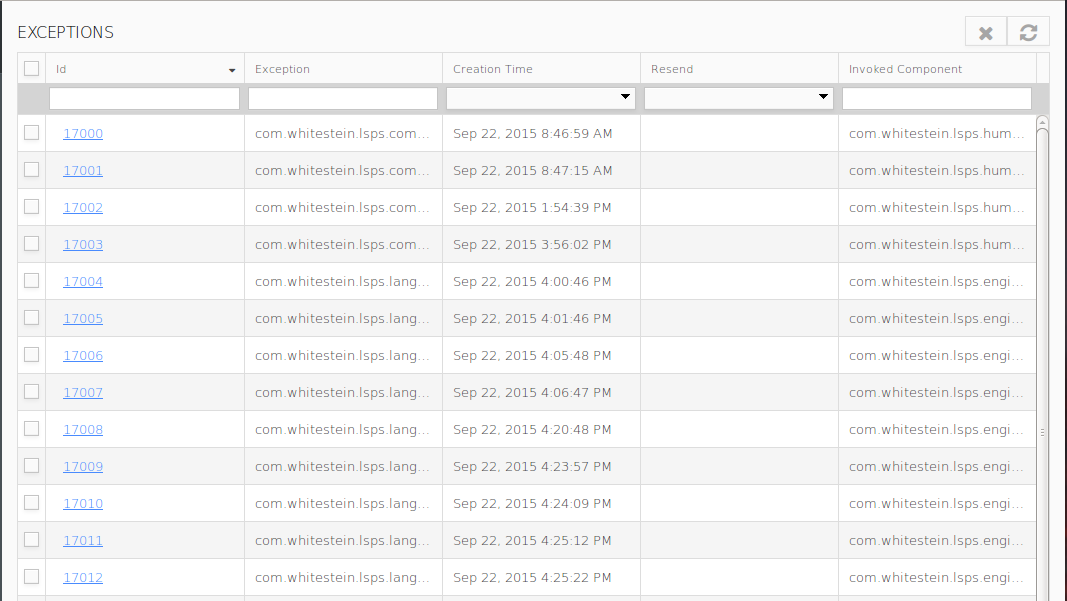
Exceptions view
Model Update Logs View
The Model Update Logs view contains a log entry for every updated model instance. You can display the log content by clicking the log ID.
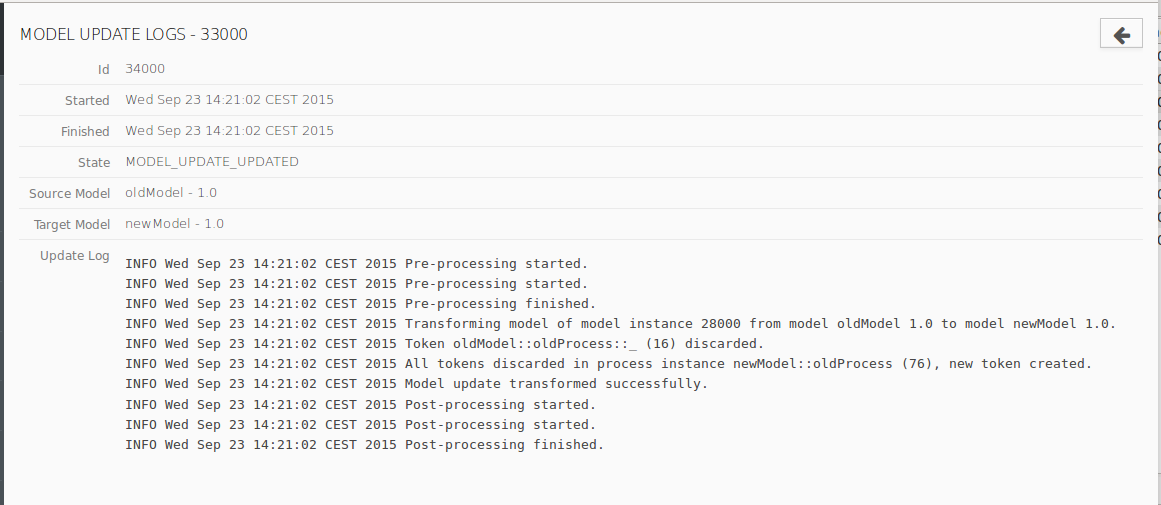
Log content