LSPS Documentation
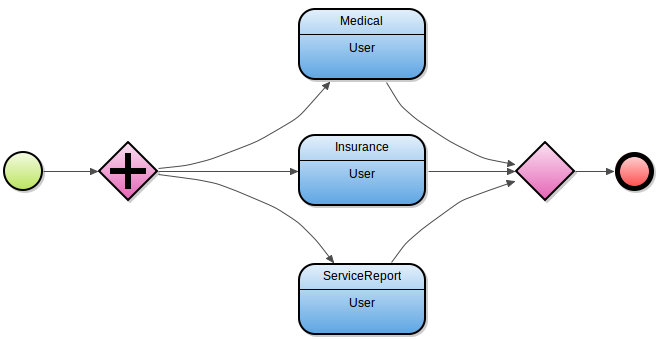
The process, organization, and data type definition files can contain diagrams which visualize their content. To edit the content of these definition files, you can use diagram editors: In these editors, you can edit the content of the definition file on a canvas typically by dragging-and-dropping elements onto the canvas.
Note: An element of such a definition does not have to appear in a diagram: it can exist in the definition without its Diagram representation. And one element can appear in multiple diagrams but is still the same element that exists in the definition only once. Hence diagrams can contain the following:
one view of an element: graphical representations of elements from the definition;
For example, a diagram in an organization definition can contain one view of any Role or Organization Unit in the organization definition.
- diagram elements such as annotations; such elements do not have any semantic value for execution but serve to provide information to the user.
For more information on the Diagram types, elements, and content, refer to GO-BPMN Modeling Language Specification.
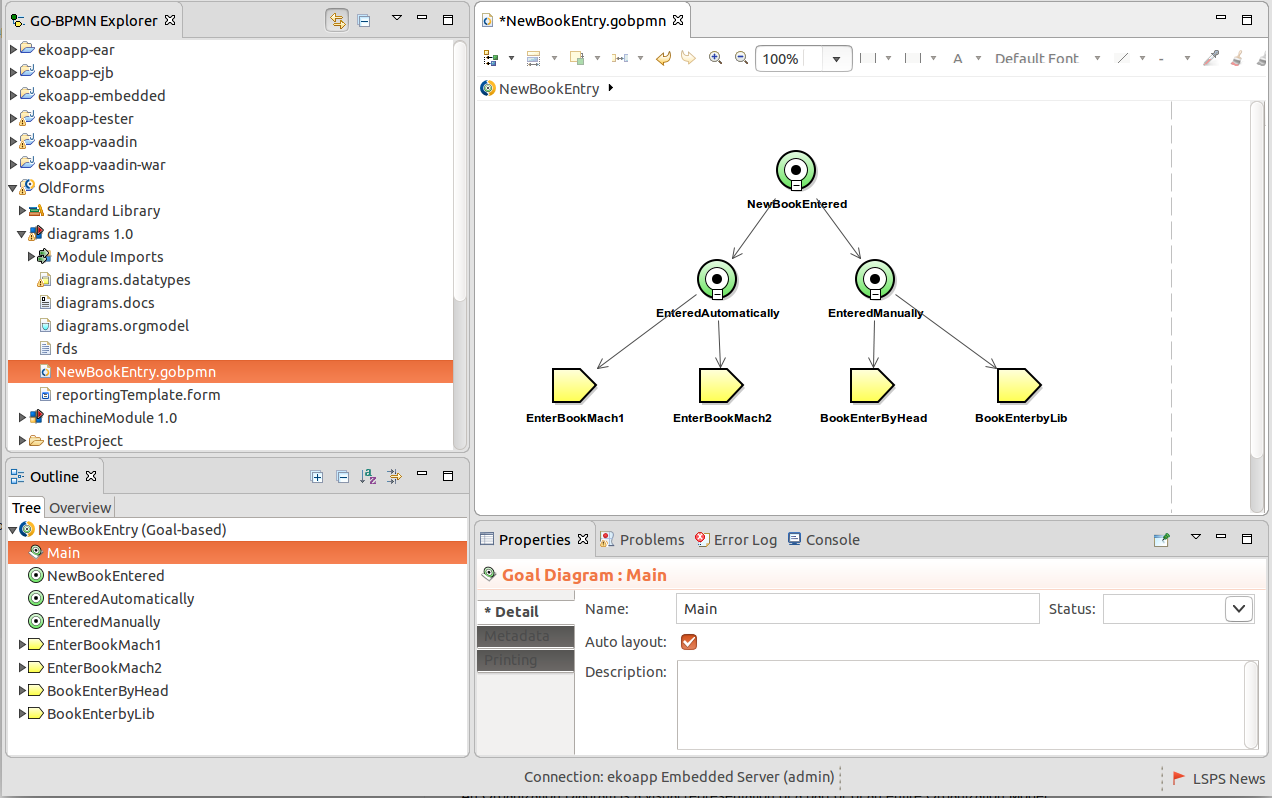
When you create a resource that supports Diagrams, the system automatically creates a default Diagram in the resource file and displays it in the respective diagram editor.
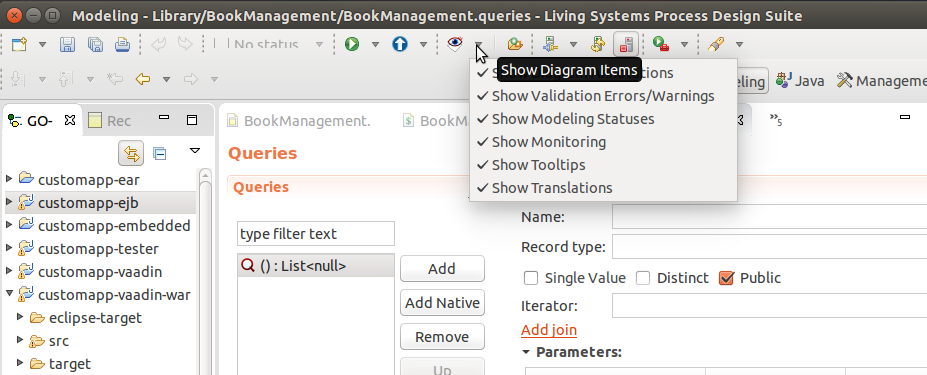
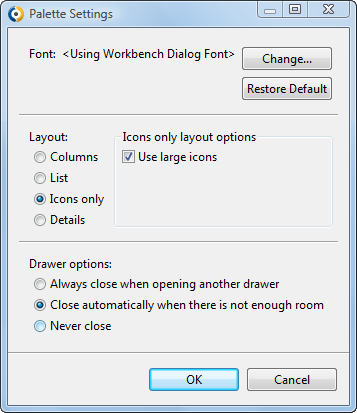
You can apply the following global settings to your diagram editors available in the main toolbar:
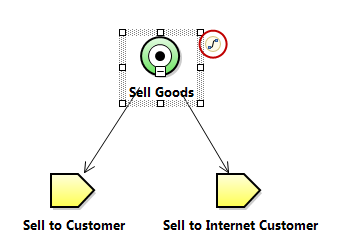
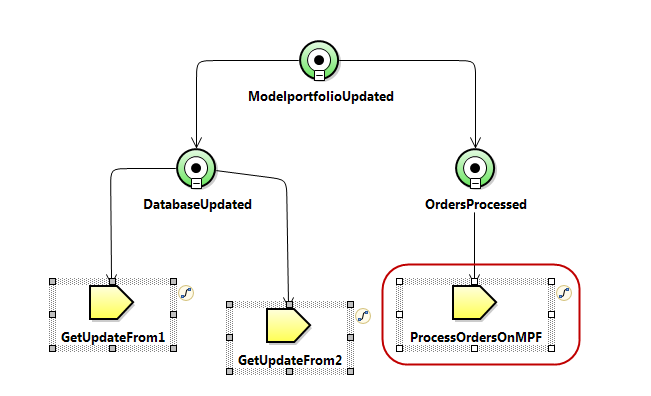
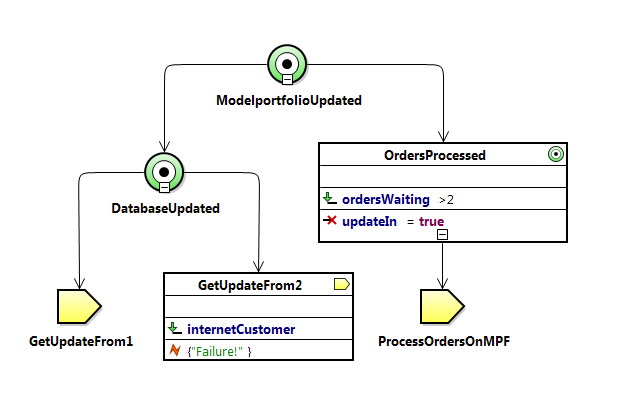
Show Monitoring: if unselected, monitoring markers on elements with monitoring expressions are hidden.
Monitoring expressions hold expressions that store monitoring data. Such data can be then used in monitoring applications.
After you have created a definition, which supports diagrams (process, organization, or data type definition, or a process in the model update configuration), the system creates a diagram in the file and opens it in the respective diagram editor. However, you can decide to create multiple diagrams in one file with different element views. To create a new diagram, do the following:
Any view of an element with a semantic value that you insert into a Diagram is automatically created in the definition file, for example, if you insert a Role view from the palette or from the context menu of the canvas into an Organization Diagram, the system automatically creates the Role element in the definition file.
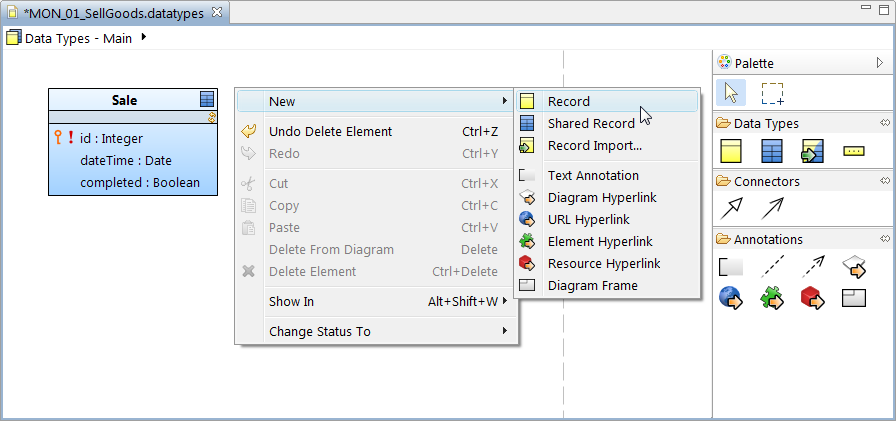
To create a new element and insert its view into a diagram:
Alternatively, right-click empty space in the canvas and select the element from the context menu.
You can insert an element view in between two elements connected with a flow by placing the view on the Flow element: the Flow will be split in two Flows with the element in between.
To align element views in a diagram editor according to one of the elements, do the following:
Select the elements on the canvas: Either drag a select box around the elements or use the Ctrl + left-click.
The align is performed according to the primary element. The primary element is the element in the selection with white border points. To mark another element as the primary element of the selection, press and hold the Shift key and left-click the element.
 ) button on the editor toolbar and pick the align type.
To match sizes of several diagram elements to the size of one element, do the following:
Select the primary element: it is the properties, that is, width and height, of this elements that are applied to the other selected elements.
The primary element is the element in the selection with white border points. To mark another element as the primary element of the selection, press and hold the Shift key and left-click the element.
 ) button, and select the resizing strategy:
When spreading elements, the selected element are rearranged in such a way that the space they occupy remains unchanged while the "gaps" between the elements become equal.
To spread diagram elements in a diagram editor evenly, do the following:
 ) button on the editor toolbar and pick the spreading strategy:
To change the type of a diagram element, do the following:
When deleting an element view in a diagram, you can either delete the element with all its view or delete only the view and preserve the respective element.
Note: You will not be able to add a breakpoint to elements with no diagram view (icon representing the element) when debugging.
To remove an element or its view:
The grid provides helping lines and allows you to align element views on diagrams automatically.
To set and display the grid, do the following:
select Snap to geometry to snap element to the grid guidelines when moved
When moving a diagram view or element, guidelines indicate a border (top, bottom, left, or right) of another diagram icon.
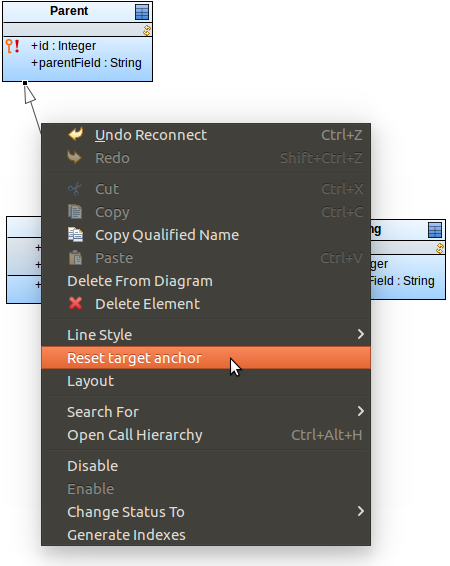
When you connect two diagram elements with a line element, such as a flow, annotation, etc., you can adjust where they connect to the element views: drag the anchors, the black squares, pointing toward the center of the element view to the required position.
You can restore the original anchor position from the context menu of the line element.
You have activated a diagram editor.
To display page borders in diagrams, do the following:
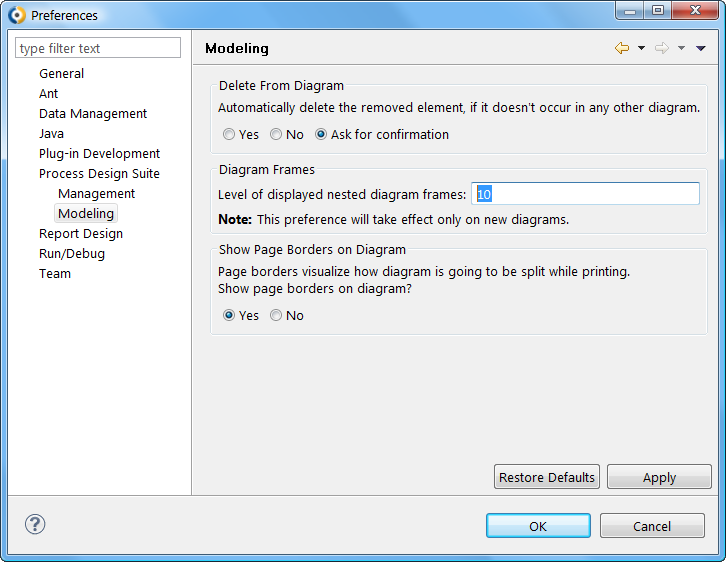
You can restrict the level of allowed diagram frame nesting in Window > Preferences and then Designer > Modeling.
To insert a hyperlink, do the following:
Alternatively right-click anywhere on the canvas, and select New and the desired Hyperlink or drag the respective element onto the canvas (if applicable, select Create Hyperlink in the displayed menu).
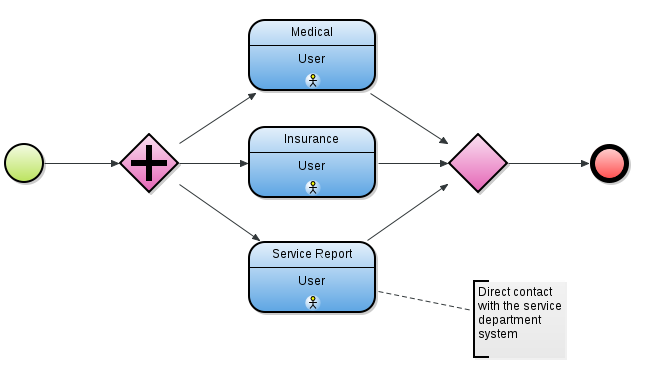
Some diagram views can be displayed in two notation variants:
Notation variants (iconic and decorative) are available for the following element views:
To change notation of a diagram element, do the following:
When applying decorative notation, you may chose the details, which should be shown: in the context menu of the element icon select Compartments and select the compartments to be displayed.
You can hide the task type compartments of the task elements, inherited fields in a record, etc.
To hide or display the compartments on a diagram element, do the following:
Note that the element settings can be overridden by global settings: to access the Settings go to Window > Preferences and in the dialog go to Modeling > Appearance. The setting are in the Compartment Settings section.
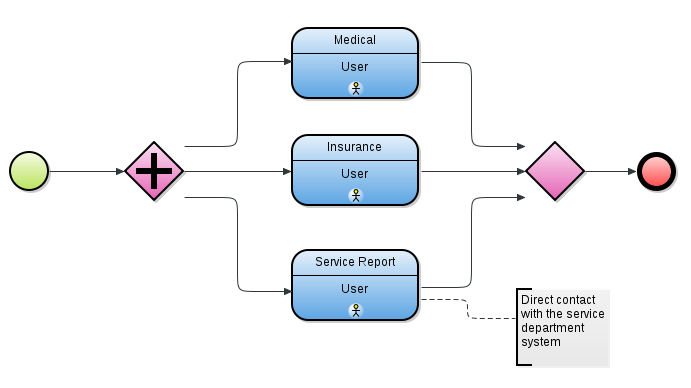
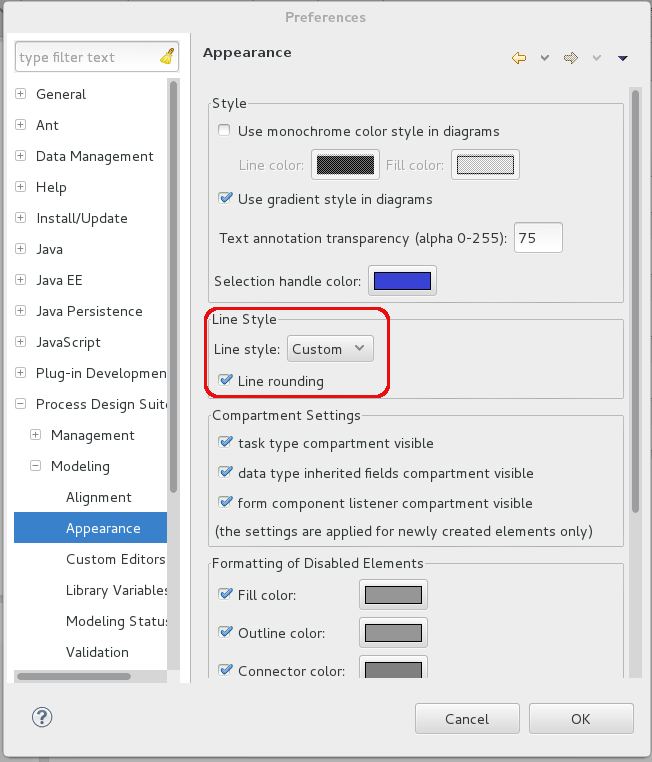
The line style defines the behavior of line elements and their bending.
The following line styles are available:
Note that the default line style is defined by global settings: to access the Settings go to Window > Preferences and in the dialog go to Modeling > Appearance. The setting are in the Line Style section.
Formatting settings define how the diagram elements are depicted and organized in the diagram.
Every diagram element defines a set of its formatting properties, such as its fill color, outline color, text font, displayed compartments etc. (refer to Defining Custom Format of Elements and Compartments of Diagram Elements). Apart from the element formatting properties, diagram editors define global formatting settings, which override the local settings and define additional formatting properties.
To get and apply a custom format style on an element view, do the following:
 ).
). ) button.
The format style is applied to the element. The custom format style may not be visible since custom formatting is overridden by the monochrome and status formatting style.
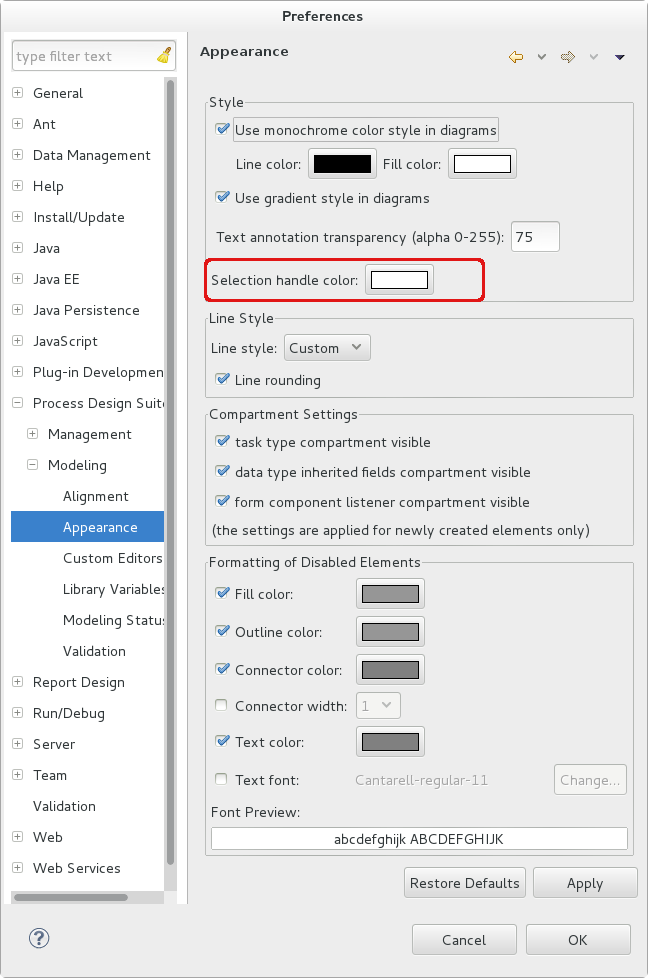
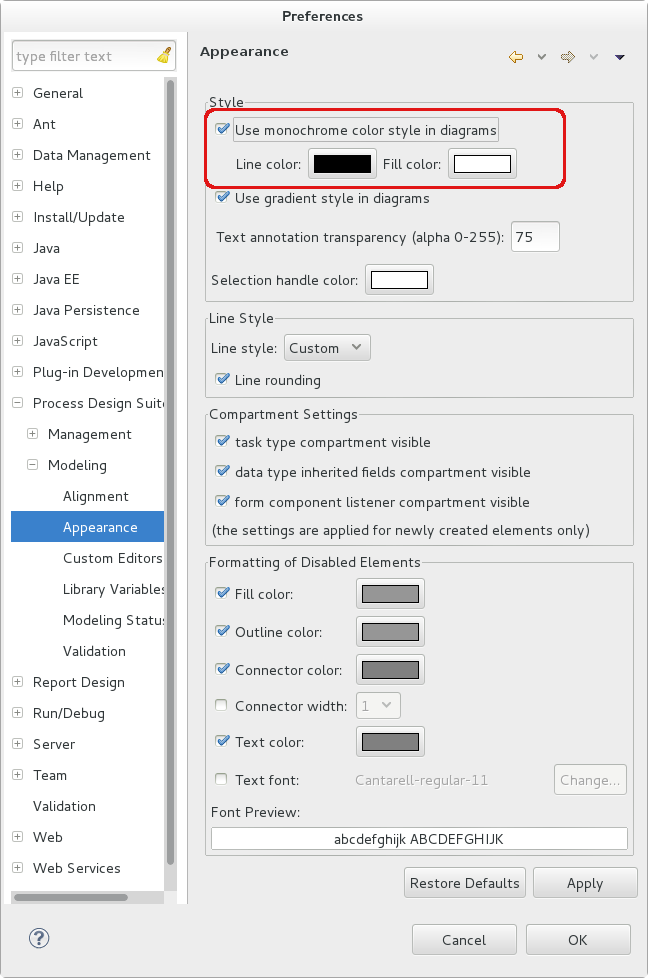
Monochrome style is a two-color style applied to diagram elements. By default the style is set to black-and-white.
It overrides any custom style (if applied to diagram elements with custom color style, the elements loose their coloring). However, it does not influence the status coloring.
To activate or deactivate and modify the monochrome style, do the following:
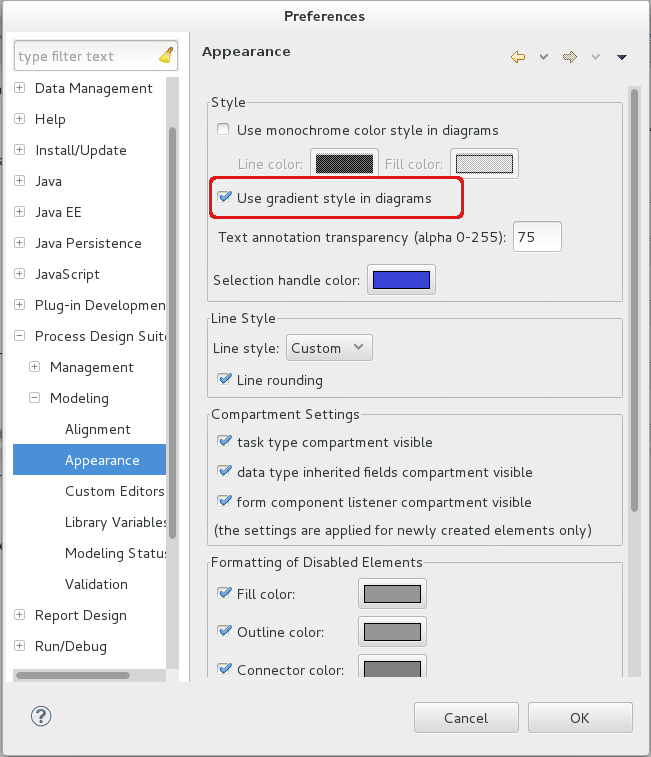
To deactivate or activate the gradient style of diagram elements:
To deactivate or activate and define transparency property of Text Annotations:
To change the color of the primary element, do the following:
The line style defines the style how the line elements bent.
To change the default line style, do the following:
You can define the formatting of every diagram element view. Such custom formatting is however overridden by the monochrome and modeling status format.
To customize the formatting of a diagram element, do the following:
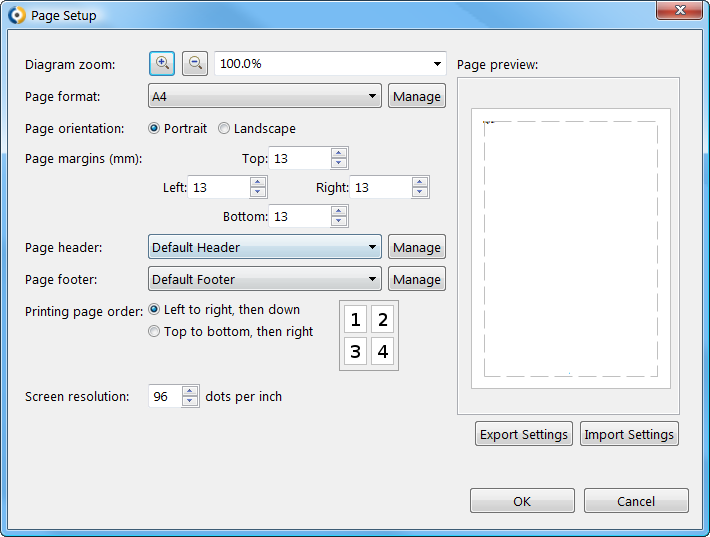
When printing Diagrams, the system follows the global page setup by default. However, you can override its setting in a local setup defined per Diagram.
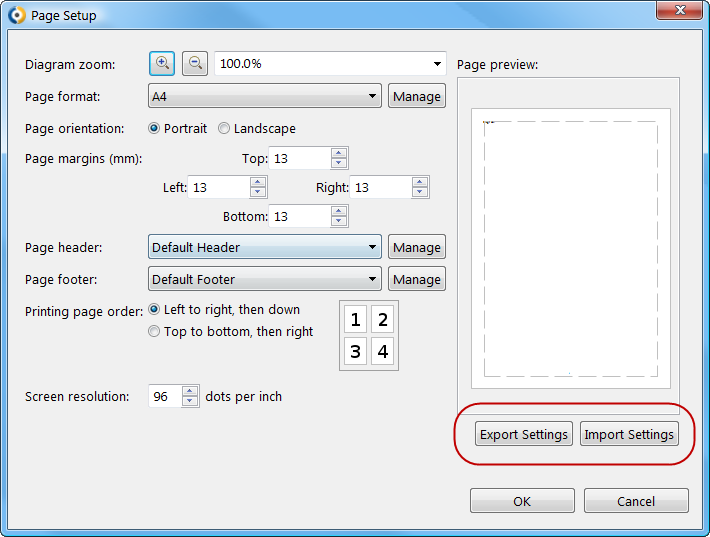
You can export and import local page setups so you can share them with other users and print your Diagrams with the same settings.
The setting is applied on every diagram printing and PDF export unless the local page setup is applied.
To define the global page setup, go to File > Page Setup.
To define printing setup for a Diagram, set the printing properties in the Printing tab of the Properties view. Mind that this setting is applied whenever the diagram is included in a PDF or image export and you need to disable the local page setup to re-apply the global page setup on the diagram.
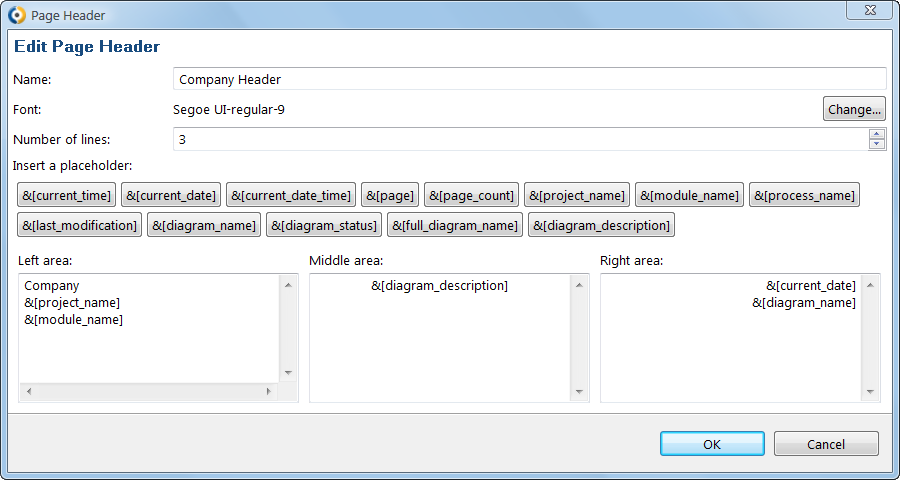
To define header or footer in a global or local page setup, do the following:
To export or import the global page setup, do the following:
The Designer allows exporting diagrams as images, and groups of diagrams as a structured PDF document.
A diagram can be exported into the PDF format and as an SVG, PNG, JPG, or BMP image.
Important: When exporting a diagram to SVG, make sure the diagram font is installed on your system. The default font used in diagrams is Arial, which is installed on MS Windows by default. Hence this applies especially to users of other operating systems.
Alternatively you can change the diagram font for Designer: go to Window > Preferences and in the Preferences dialog, go to General > Appearance > Colors and Fonts, and under Designer, select Diagram Font and click Edit.
Note that the exported SVG diagram has the clip attribute on the <svg:text> Element. The attribute might cause the text to be cut off. Delete the attribute in your SVG to resolve the issue.
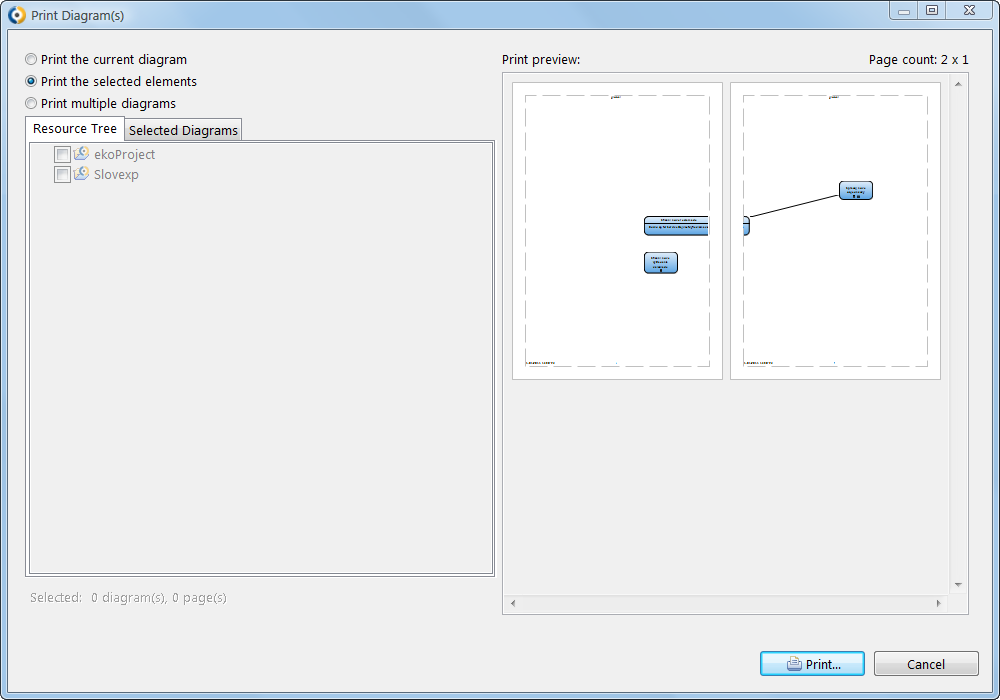
To print a selection of diagram elements:
Note: The page setup applied to individual diagrams is applied also on its printing (that is, the global page setup is applied by default; if a diagram defines a local page setup, for printing of this diagram the local page setup is applied, see Page Setup).
To print several diagrams from a project or Module, do the following:
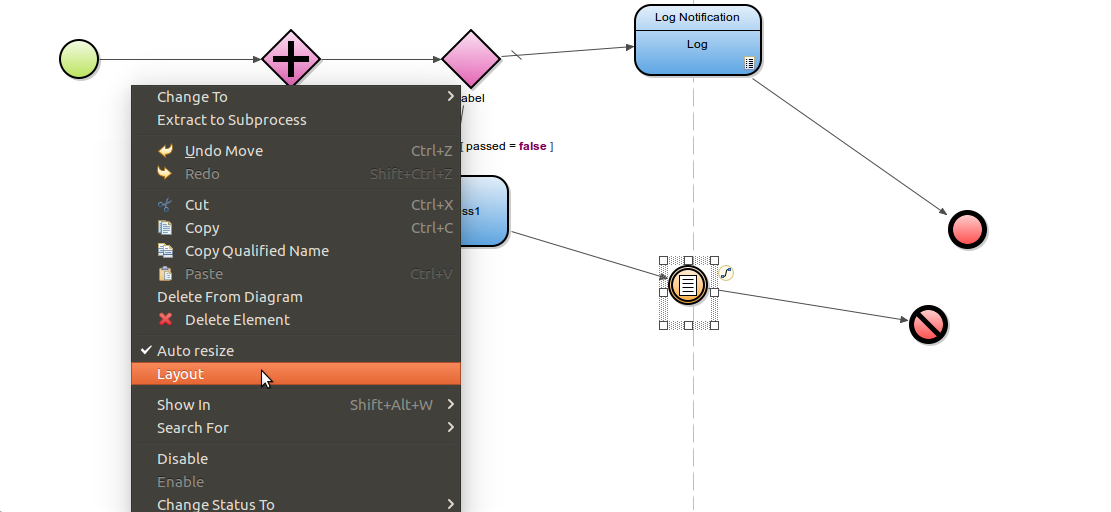
The automatic formatting of diagram views, does the following:
To automatically adjust the element layout in your diagram, right-click into the diagram canvas and select Layout.
Note: If an element displayed in a process diagram contains a boundary event, the layout feature is disabled.
If you want to adjust the layout of the elements in a Diagram whenever the diagram is opened, do the following:
The diagram elements will be laid out automatically anew whenever the diagram is opened: Note that the editor with the diagram will be marked as dirty (with the asterisk * sign).